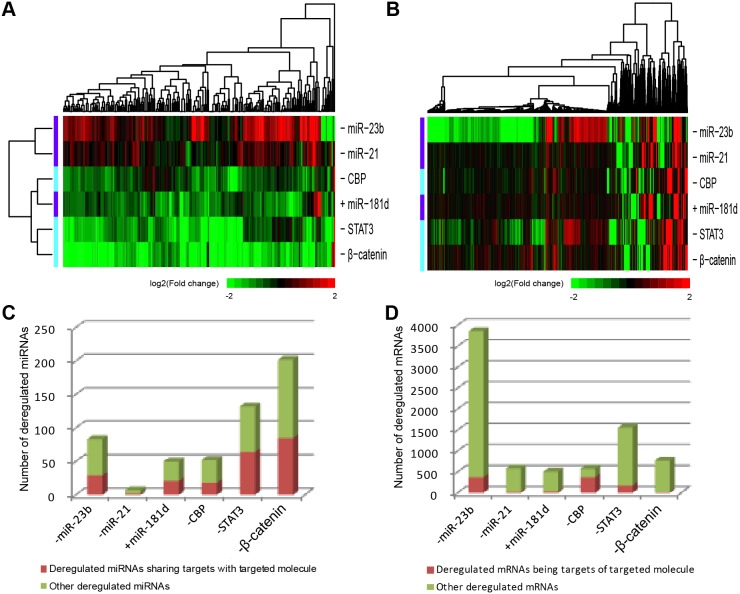
Figure 1. Changes in the expression of significantly deregulated miRNAs and mRNAs after each manipulation.
(A) Two-way hierarchical clustering of deregulated miRNAs resulting from all the six experimental manipulations, which are globally sorted into two groups, based on log2 fold changes. (B) One-way hierarchical clustering of deregulated mRNAs resulting from each manipulation based on log2 fold changes. Up- and downregulation of gene expression are represented by red and green colors, respectively, while black indicates no change relative to baseline levels. The number of (C) miRNAs and (D) mRNAs significantly deregulated by each manipulation, with the fraction of these that share targets with the manipulated molecule marked with red.

