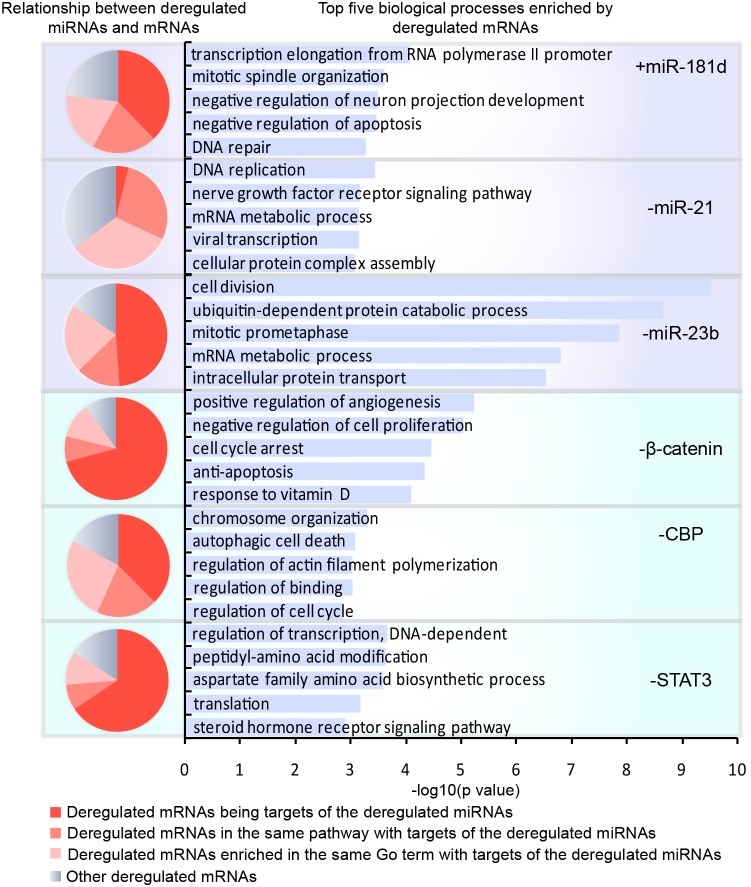
Figure 2. The function of mRNAs with altered expression and their relationship to deregulated miRNAs after each manipulation.
The proportion of differentially expressed mRNAs in each type of relationship to deregulated miRNAs is shown in a pie chart, in which the intensity of the red color indicates the degree of association, with a more intense color representing a direct association; blue is used to indicate an unspecified relationship. The five biological processes most significantly enriched by altered mRNAs resulting from each manipulation are listed.

