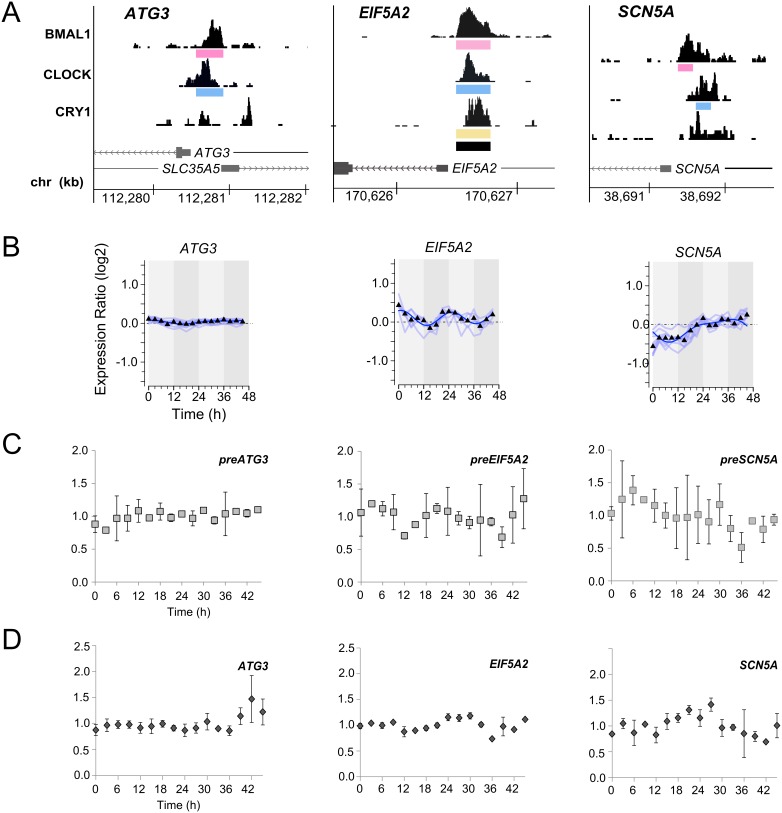
Figure 5. Expression analysis of genes with CRBSs in their promoters.
(A) UCSC browser views of BMAL1 (top), CLOCK (middle) and CRY1 (bottom) occupancy at the promoters of ATG3, EIF5A2, and SCN5A. Binding sites of the individual transcription regulators are indicated by colored bars. Black bars indicate common binding sites of the three regulators. (B) Temporal expression profiles (microarray analysis) of ATG3, EIF5A2, and SCN5A, which have strong CRBSs in their promoters. (C, D) Around the clock qRT-PCR analysis of preRNA (C) and mRNA (D) levels of ATG3, EIF5A2, and SCN5A. qRT-PCR analysis was carried out with intron- and exon-specific probes, respectively, of ATG3, EIF5A2, and SCN5A using RNA of time courses A and B. Expression levels of HPRT1 were used for normalization.

