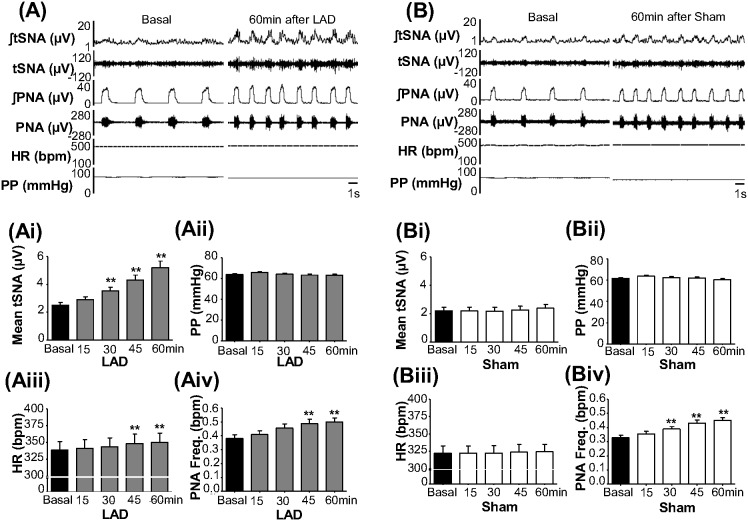
Figure 3. Baseline changes post LAD ligation.
Typical traces of raw and integrated tSNA and PNA, ECG and PP before (Basal) and up to 60 min post LAD ligation (A) and in Sham operated (B). Means of tSNA, PP, HR and PNA frequency before (Basal) and at 15, 30, 45 and 60 min post LAD ligation (Ai, Aii, Aiii and Aiv, respectively, n = 21) and Sham operated (Bi, Bii, Biii and Biv, respectively, n = 19). **P<0.01 compared to Basal.

