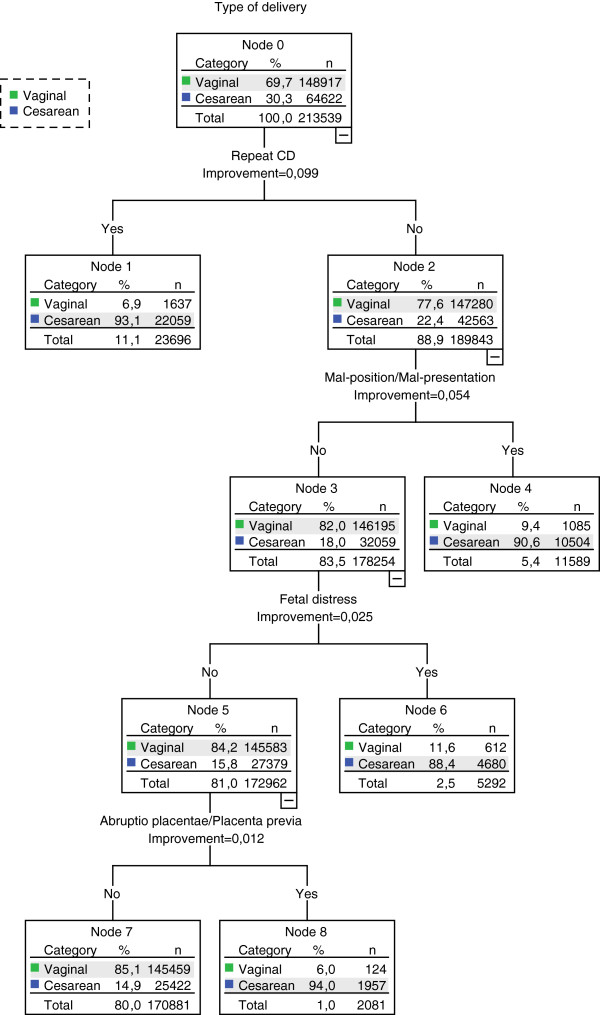
Figure 1.

Classification tree showing sub-groups with different risk of CD (primary analysis).Note: This tree includes only those variables that contribute significantly to sub-typing women into homogeneous groups in terms of CD rates (i.e., only relevant predictors of CD). Abbreviations:CD, cesarean delivery.
