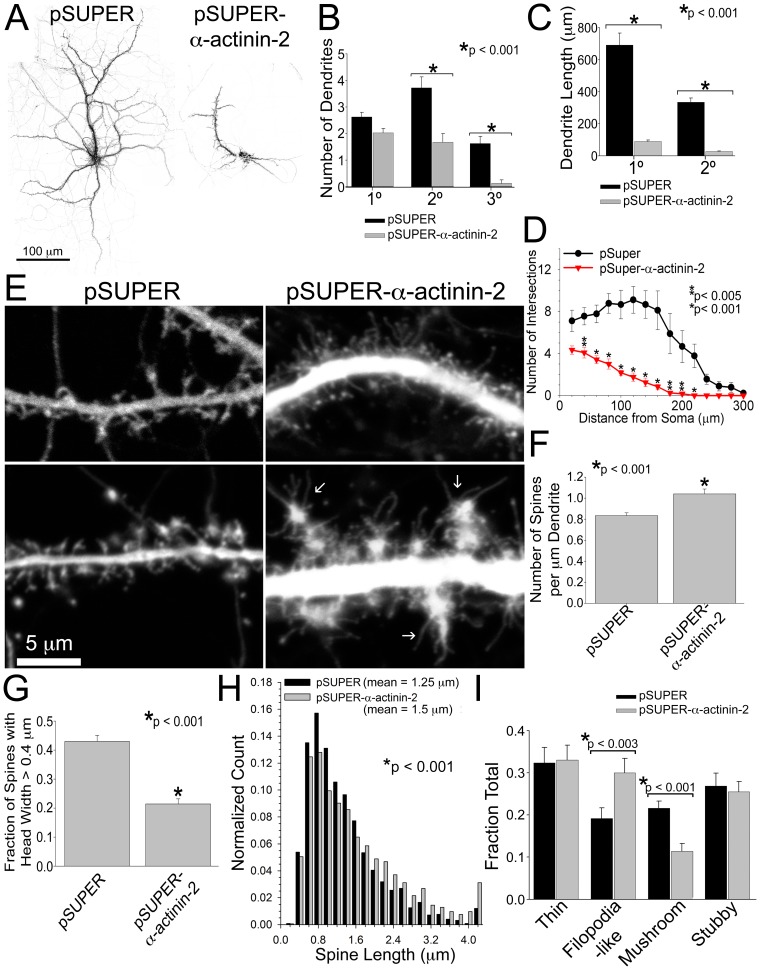
Figure 3. α-Actinin-2 contributes to development of dendritic arbors and spine morphology in early cultures.
A–C) Hippocampal neurons were co-transfected at DIV 6 with GFP and either pSUPER or pSUPER-α-actinin-2 and fixed on DIV 22. Note the reduced size and number of dendrite arbors on neurons lacking α-actinin-2. While there is no difference in the number of primary dendrites, the number of secondary and tertiary dendrites on neurons lacking α-actinin-2 is reduced, B. The length of primary and secondary dendrites is smaller in neurons with α-actinin-2 knocked down, C. The branching complexity is reduced in neurons lacking α-actinin-2, D. Dendrites from 17 control neurons and 21 α-actinin-2 knockdown neurons from 2 different cultures were analyzed. E) Hippocampal neurons were co-transfected at DIV 6 with GFP and either pSUPER or pSUPER-α-actinin-2. Neurons were fixed on DIV 21 and scored for (E–I) changes in spine density, length, head width, and morphology. Two examples of control neurons and α-actinin-2 knockdown neurons are shown. Arrows point to irregularly shaped protrusions containing numerous filopodia, which is observed in several α-actinin-2 knockdowns. Inhibition of α-actinin-2 increases the number of spines per µm length of the dendrite (spine density), F. Spine density was quantified from 73 control neurons and 65 α-actinin-2 knockdown neurons from more than 3 cultures. The fraction of spine head widths >0.4 µm is significantly reduced in neurons with α-actinin-2 knocked down, G. Spine length is shifted to the right (longer) in neurons lacking α-actinin-2, H. α-Actinin-2 knockdown creates an increase in the fraction of filopodia-like spines (long protrusions without a spine head) and a concomitant decrease in the fraction of mushroom-shaped spines, I. For quantification of spine width, length, and morphology, 1875–2245 spines from 29 control neurons and 35 α-actinin-2 knockdown neurons from more than 3 cultures were analyzed. Error bars represent standard error of the mean (SEM). p-values were derived using the paired t-test (B, C, D, H, I) and Mann-Whitney test (F, G).

