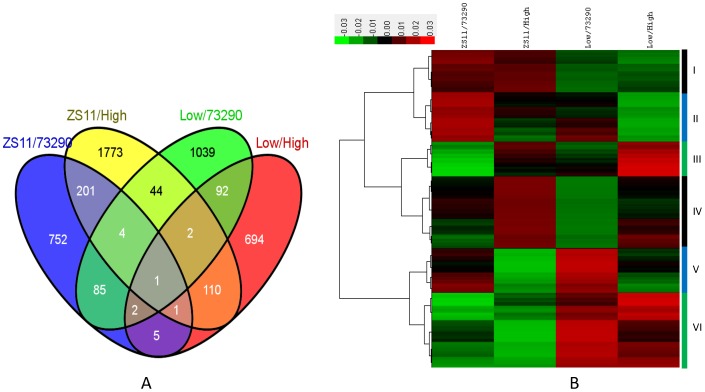
Figure 2. Transcriptomic analysis of the MI of ZS11, 73290, and the two F6 pools.
(A) Venn diagram of differentially expressed genes (DEGs) between the low-NPMI and high-NPMI samples (p<0.05, absolute fold change of ≥1.5). (B) Hierarchical cluster analysis of genes that were detected as being differentially expressed in at least one of the low-NPMI versus high-NPMI pairs. Red indicates up-regulation and green denotes down-regulation. I–VI indicate the six clusters, and the color bars on the right denote the range of each cluster. Low and High indicate the Low-NPMI and High-NPMI RNA samples, respectively.

