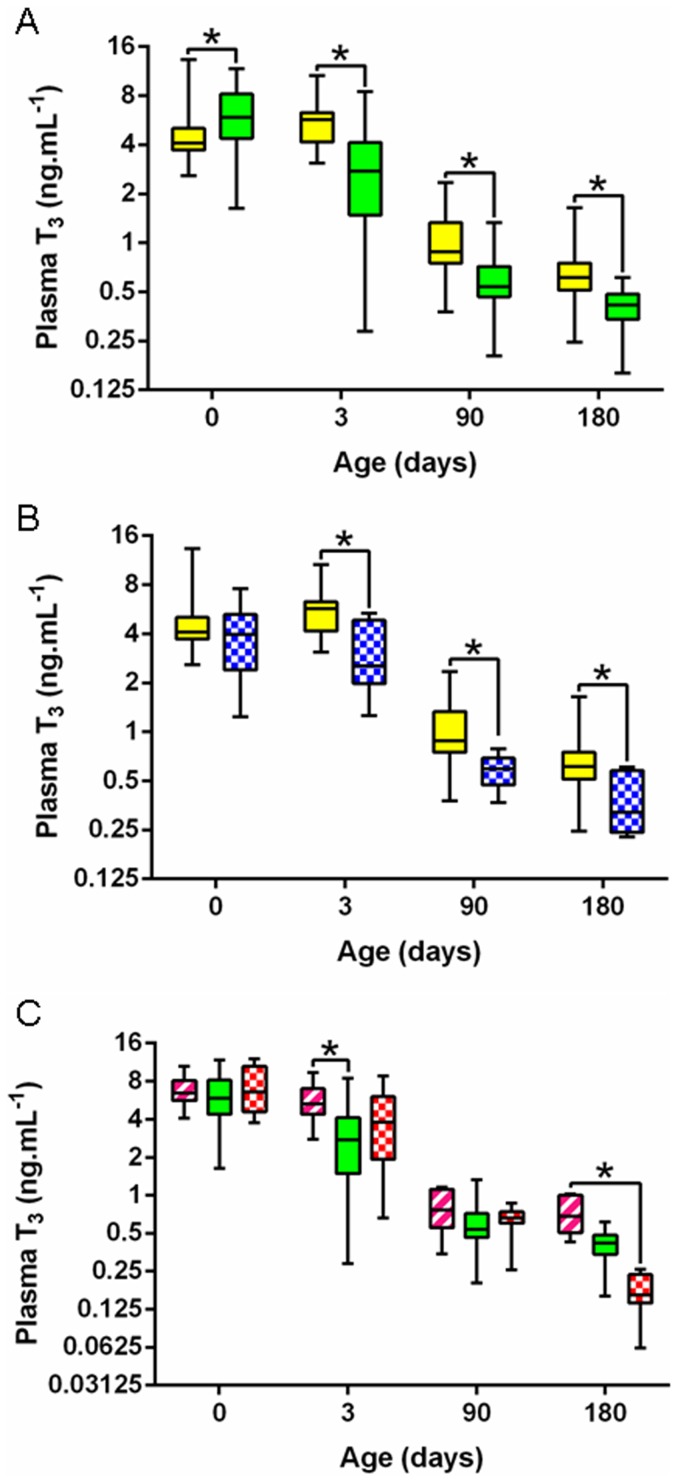
Figure 5. Foals' plasma T3 levels from birth to weaning in the five groups.
A: P-P (full yellow) vs S-S (full green). B: P-P (full yellow) vs P-D (chequered blue). C: S-P (striped pink) vs S-S (full green) vs S-D (chequered red) (P-P: Pony in Pony, P-D: Pony in Draft, S-P: Saddlebred in Pony, S-S: Saddlebred in Saddlebred, S-D: Saddlebred in Draft). Curves are presented as medians and interquartile ranges and the scale on the y-axis is semi-logarithmic. The median values under the asterisks differ significantly from each other (F1-LD-F1 model followed by Mann-Whitney or Kruskal-Wallis test, p<0.05.

