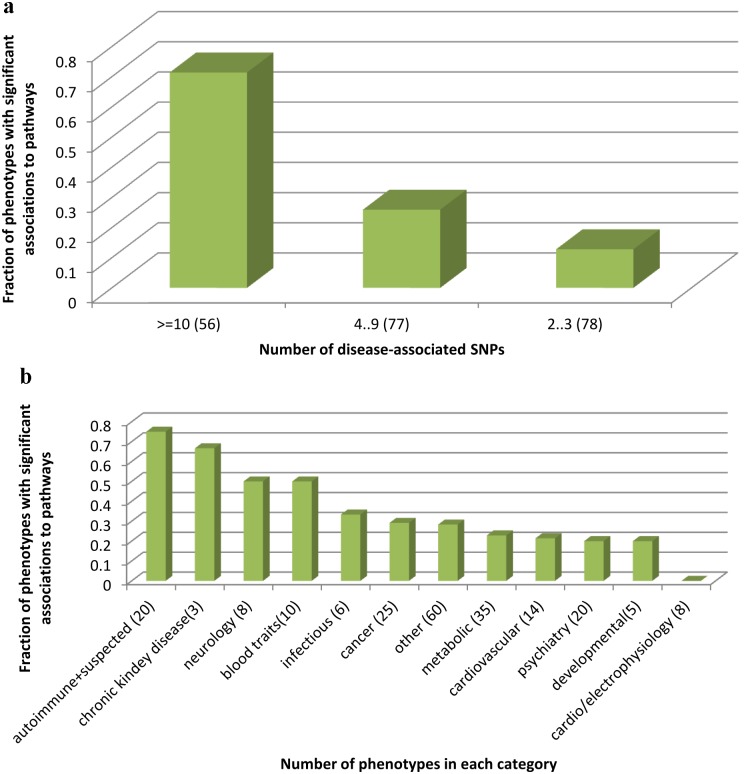
Figure 2. Tendency of different classes of phenotypes to have their SNPs cluster into pathway.
X-axis presents phenotypes grouped by categories, while Y-axis represents what fraction of the conditions in this category had at least one significant association with pathways. A. Conditions are grouped according to the number of disease SNPs they have (that is SNPs that are significantly associated with the phenotype). Phenotypes for which GWAS found more phenotype SNPs are more likely to be significantly associated with pathways. B. Phenotypes are grouped according to types. Autoimmune diseases have a high tendency to cluster to pathways, while other categories, such as psychiatry and metabolic related phenotypes, much less so.

