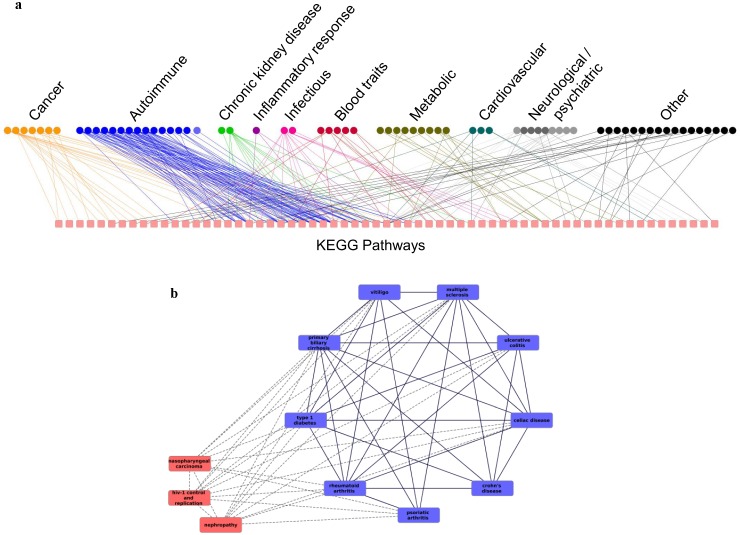
Figure 5. Network representations of phenotype-pathway and phenotype-phenotype associations.
A. Each node on the top row of this bipartite graph represents a phenotype. Each square on the bottom row represents a pathway. Autoimmune diseases tend to associate with the same pathways while other classes of phenotypes associate with different pathways B. Nodes represent phenotypes. An edge indicates that both phenotypes are significantly associated with at least 3 common pathways. Blue nodes are autoimmune phenotypes while red nodes are non-autoimmune. Solid lined links are between two autoimmune phenotypes while dotted lines show links to other phenotypes.

