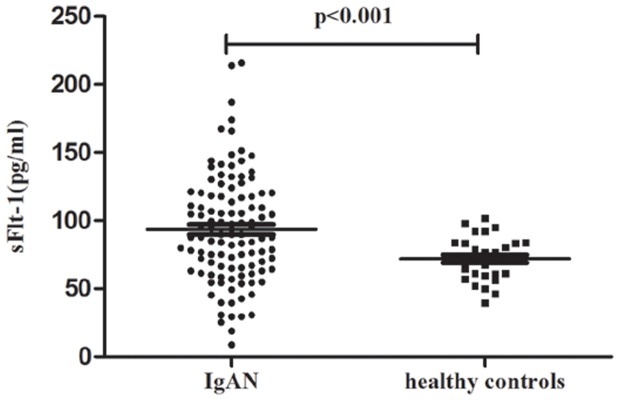
Figure 1. Validation of sFlit-1 levels in the replication cohort.

Scatter plot showing the distribution of sFlt-1 levels in IgAN patients and healthy volunteers in the replication cohort. Patients with IgAN showed significantly elevated sFlt-1 levels compared to healthy volunteers.
