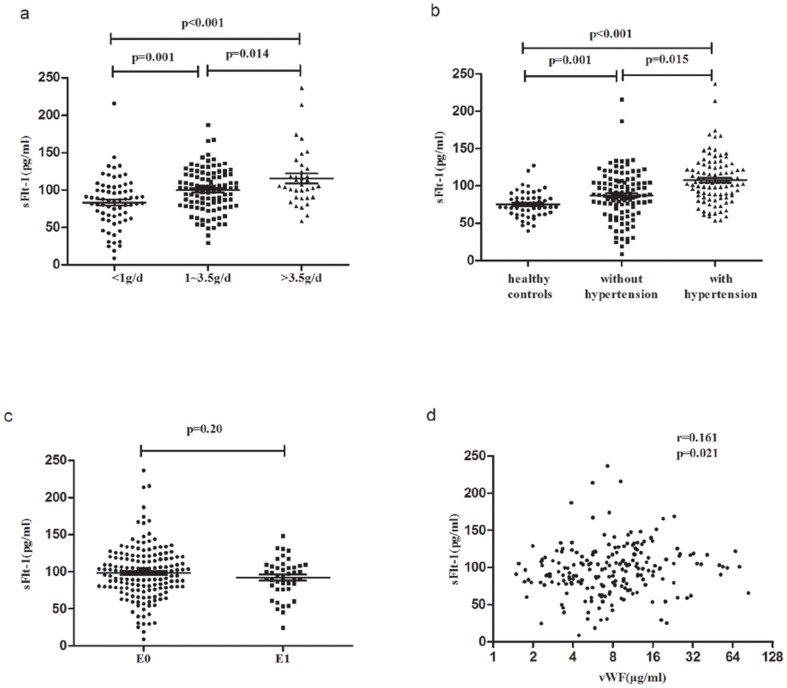
Figure 2. Correlations of sFlt-1 with proteinuria, hypertension, Oxford-E score and vWF levels.
a. Scatter plot showing the distribution of sFlt-1 levels in IgAN patients according to different degrees of proteinuria. Patients with mild proteinuria (<1 g/d) showed lower plasma sFlt-1 compared to patients with moderate (1–3.5 g/d) and severe proteinuria (>3.5 g/d). b. Scatter plot showing the distribution of sFlt-1 levels of IgAN patients according to hypertension. IgAN patients with hypertension presented significantly higher sFlt-1 levels than patients without hypertension and healthy volunteers. Furthermore, IgAN patients without hypertension also showed higher sFlt-1 levels than healthy volunteers. c. Scatter plot showing the distribution of sFlt-1 levels in IgAN patients according to Oxford-E score. The sFlt-1 levels were similar in the E1 group compared to the E0 group. d. Scatter plot showing the correlation between sFlt-1 and vWF levels. Plasma sFlt-1 levels were significantly correlated with vWF levels.

