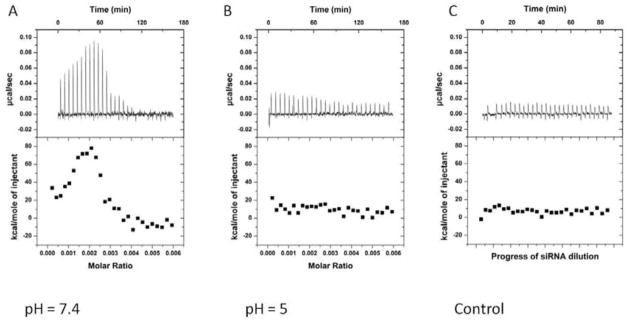
Figure 5.

Comparison of data from isothermal titration of 0.128 mM 9N-lipid complex (1/10 (mass/mass)) with 3.8 μM siRNA at pH = 7.4 (A) and pH = 5 (B). Panel C is siRNA only addition. Top panels: raw heat signals. Lower panels: Integrated areas corresponding to each titration.
