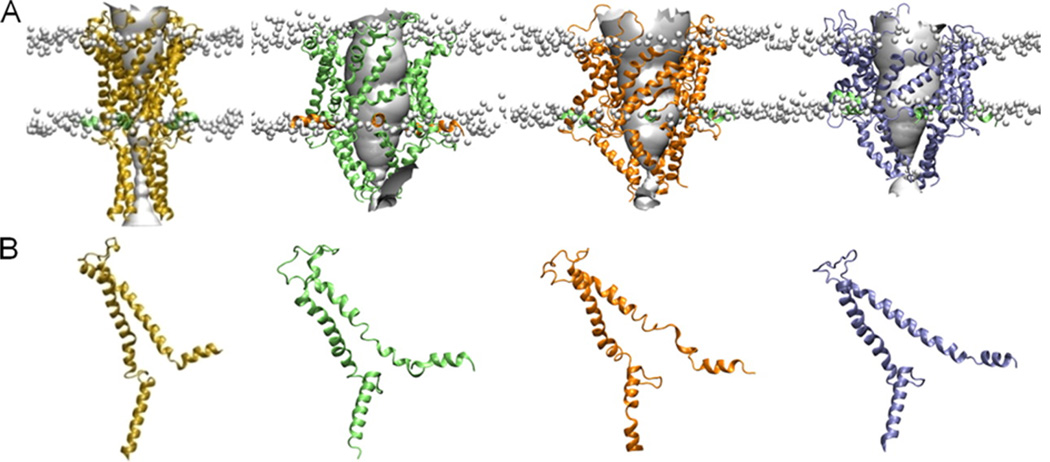
Figure 4.
Mechanical activation of the MS channel. Simulation studies incorporating EPR and FRET data. (A) The closed state (yellow) and model open states of the protein obtained under membrane tension of 0 (green), 5 (orange), and 60 mN/m (blue), respectively, viewed in the plane of the membrane. The location of the lipid phosphate head groups is indicated by the gray balls to give an indication of the position of the membrane. (B) The structure of a single subunit of each structure is indicated. Reprinted with permission from ref 159. Copyright 2010 Rockefeller University Press.

