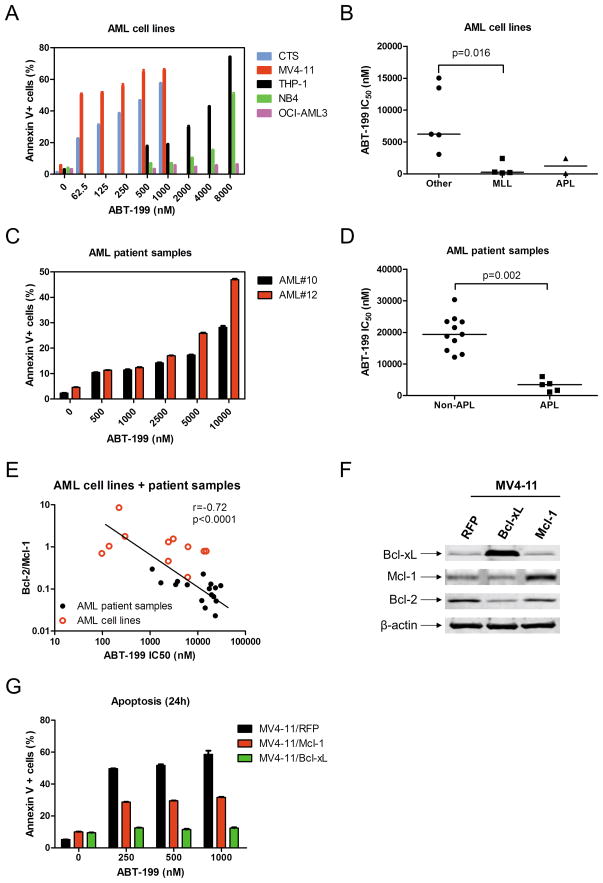
Figure 1.
Panel A: Cell lines were treated with ABT-199 for 24 h. Apoptotic events (Annexin V+) were determined by Annexin V/PI staining and flow cytometry analyses. Panel B: AML cell lines were cultured for 72 h in the presence of variable concentrations of ABT-199 and viable cell numbers were determined using MTT reagent and a microplate reader. IC50 values were calculated as drug concentration necessary to inhibit 50% proliferation compared to untreated control cells. The horizontal lines indicate the median. Panel C: Freshly isolated AML patient samples were purified by standard Ficoll-Hypaque density centrifugation. AML patient samples #10 and #12 were treated with ABT-199 for 24 h and apoptotic events were determined by Annexin V/PI staining and flow cytometry analyses. Panel D: Ex vivo ABT-199 sensitivity was determined using MTT assays. The horizontal lines indicate median ABT-199 IC50s in each group of AML patient samples (Panel D). Panel E: Total RNAs were isolated and gene transcript levels were determined by Real-time RT-PCR. Transcript levels were normalized to GAPDH and relative expression levels were calculated using the comparative Ct method (comparing all samples to the CMS cell line expression levels). The Bcl-2/Mcl-1 ratios for the AML cell line and patient samples were graphed against the ABT-199 IC50. Panel F: MV4-11 cells were infected with Precision LentiORF Mcl-1, Bcl-xL, or red fluorescent protein control (designated MV4-11/Mcl-1, MV4-11/Bcl-xL, and MV4-11/RFP respectively) lentivirus overnight, washed, and incubated for 48 h prior to adding selection drug (blasticidin) to the culture medium. Whole cell lysates were subjected to Western blotting and probed with anti-Bcl-xL, -Mcl-1, -Bcl-2 or –β-actin antibody. Panel G: MV4-11/Mcl-1, MV4-11/Bcl-xL, and MV4-11/RFP were treated with ABT-199 for 24 h and apoptotic events were determined by Annexin V/PI staining and flow cytometry analyses. The p values were calculated using the Mann-Whitney U test. The relationship between the Bcl-2 family transcript levels/ratios and ABT-199 sensitivity were determined by the nonparametric Spearman rank correlation coefficient.

