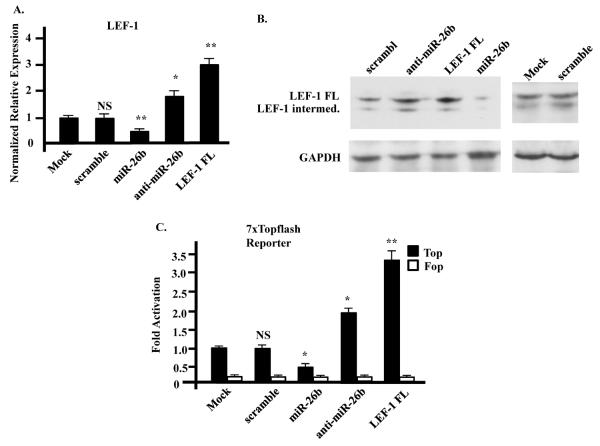
Fig. 3. miR-26b represses endogenous LEF-1 expression in SW480 cells.
A) LEF-1 mRNA levels were significantly decreased in miR-26b over expression cells, while it was increased in anti-miR-26b treated cells. LEF-1 mRNA levels were significantly increased in LEF-1 over expression cells as expected, while co-expression of LEF-1 and miR-26b reduced LEF-1 expression to normal levels. Real time PCR normalized to β-actin, N=3. B) Western blot showing that LEF-1 protein levels were reduced in miR-26b over expression cells compared with control cells, while it was increased in anti-miR-26b treated cells and LEF-1 over expression cells. LEF-1 and miR-26b combined over expression cells revealed no change in LEF-1 expression. C) Topflash reporter assays show that transfection of miR-26b vector reduced Topflash activity, whereas transfection of anti-miR-26b and LEF-1 vector increased Topflash activity. Mutated reporter (Fopflash) served as a negative control. SV-40 promoter driven β-galactosidase activity served as a control for transfection efficiency, N=3. Error bars indicate S.E.M.; *: p-value < 0.05; **: p-value < 0.01; NS: not significant.

