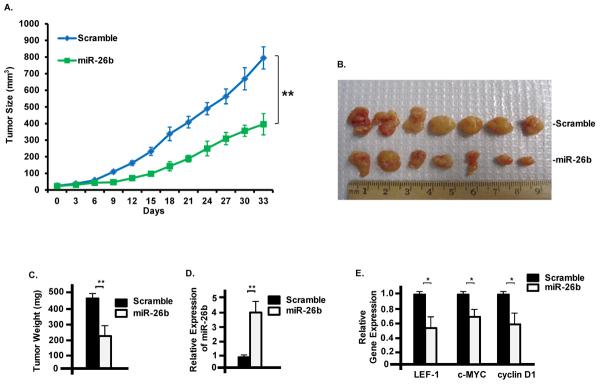
Fig. 5. Effect of miR-26b inhibition on growth of SW480 cells in xenograft model.

A) Growth curves of control and miR-26b tumors. Male nude mice were injected with SW480 cells (1×10⁷ cells) stably expressing scramble shRNA (control) or miR-26b in DMEM at either side of flank area. Tumor sizes were measured every third day to calculate tumor volumes (V=LW2/2, L:length, W:width). The two curves were analyzed by ANOVA and the p-value<0.01. B) Tumors collected for weighting and analyses of gene expression. C) The average weight of miR-26b tumors were about half of the control tumors. D) miR-26b expression was significantly increased in miR-26b tumors measured by real-time PCR. N=3. E) LEF-1, c-Myc and cyclin D1 were significantly decreased in miR-26b tumors measured by real-time PCR. N=3, experiments were run in triplicate. Error bars indicate S.E.M.; n=7; * p-value < 0.05; ** p-value < 0.01.
