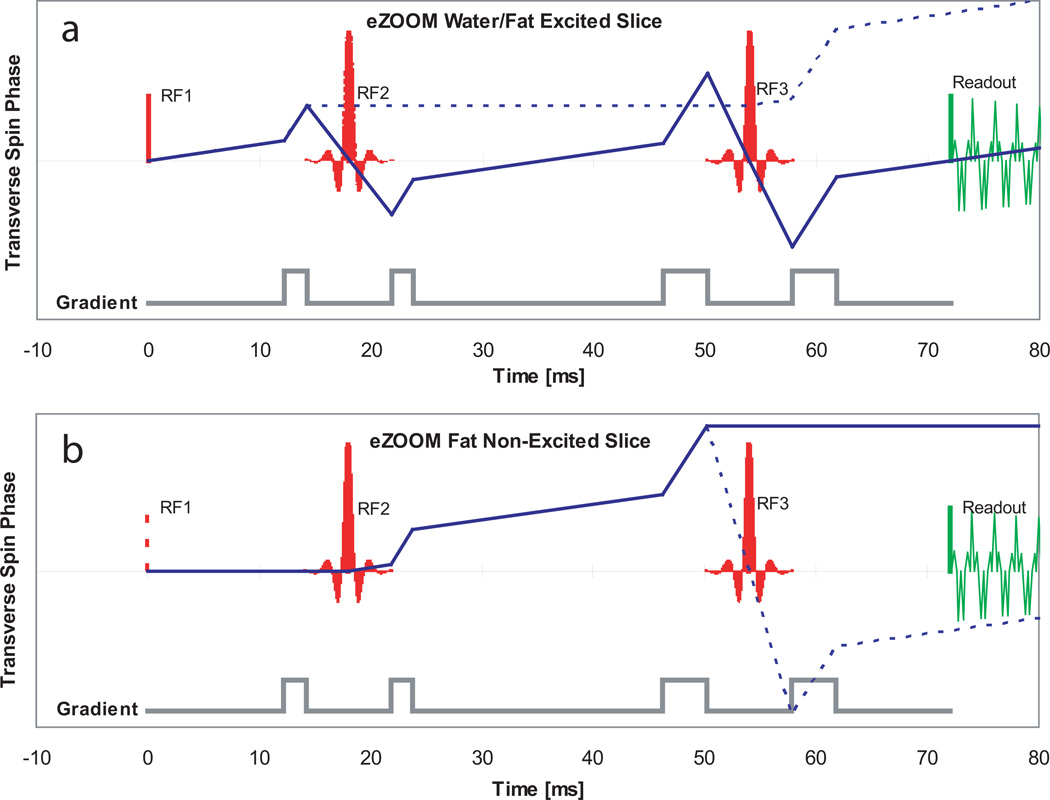
Figure 5.
Transverse spin phase diagrams for the eZOOM pulse sequence. The top panel (a) depicts the transverse phase accumulated in the excited slice for water (solid line) and fat (dashed line). The grey curve below shows the locations of the crusher gradients. RF1 is the 90° excitation pulse, the spectral-spatial RF2 and RF3 are 180° refocusing pulses for water and 270° for fat tissue. The bottom panel (b) shows the transverse spin-phase progression in the non-excited volume with the location of RF1 only given for reference (t=0). Since water spins in the non-excited volume are only flipped in the longitudinal plane at RF2 and RF3 ending up close to equilibrium magnetization after RF3, only fat spins are shown in the diagram. The solid line shows the main phase path for fat ending up without transverse magnetization at the readout point, while the dashed line shows the most prominent secondary pathway, caused by imperfections of the eZOOM refocusing pulse profile; care has to be taken to adjust crusher pulses properly to avoid refocusing of out-of-slice fat spins in the signal readout window.

