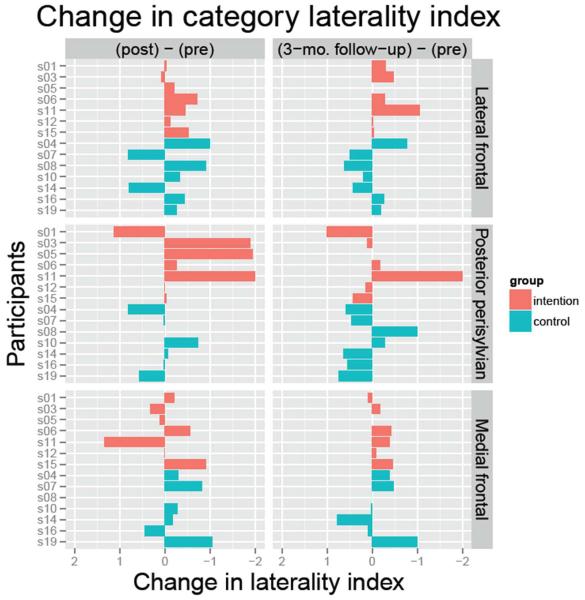
Figure 2.
Change in Laterality Indices. Changes in laterality indices from the pre-treatment fMRI scans to the post-treatment or 3-month follow-up scans are shown by individual subject. Red bars represent the Intention group; blue bars represent the Control group. Negative changes (to the right of zero) represent rightward laterality shifts.

