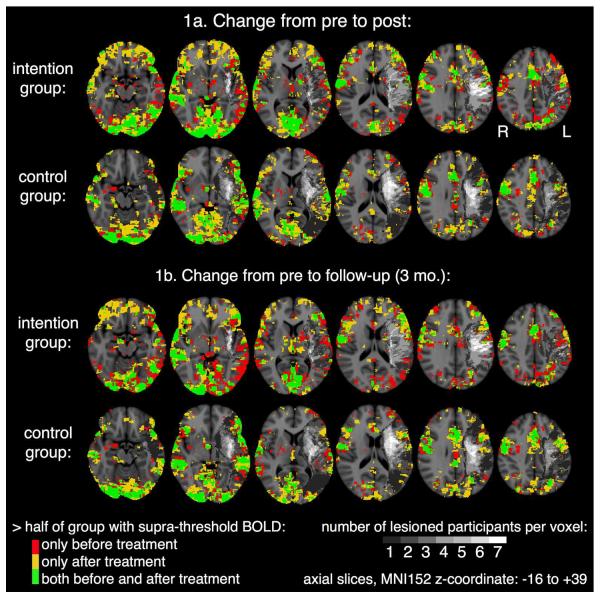
Figure 3.
Maps of Activity for Pre- and Post-Treatment (Top 2 rows) and for Pre-Treatment and 3-Month Follow-up. In green voxels, activity was present for more than half of the subjects at both Pre-Treatment and Post-Treatment (or 3-Month Follow-up); in red voxels, activity was present in more than half of subjects only at Pre-Treatment; in yellow voxels, activity was present in more than half of the subjects only at Post-Treatment (or 3-Month Follow-up). Gray to white scale represent the numbers of subjects with lesions in various left hemisphere voxels, with the darkest gray representing only 1 subject with a lesion in a voxel and white representing all seven subjects with a lesion in a voxel. Voxels with no lesion or activity are represented in the usual gray-scale for anatomy.

