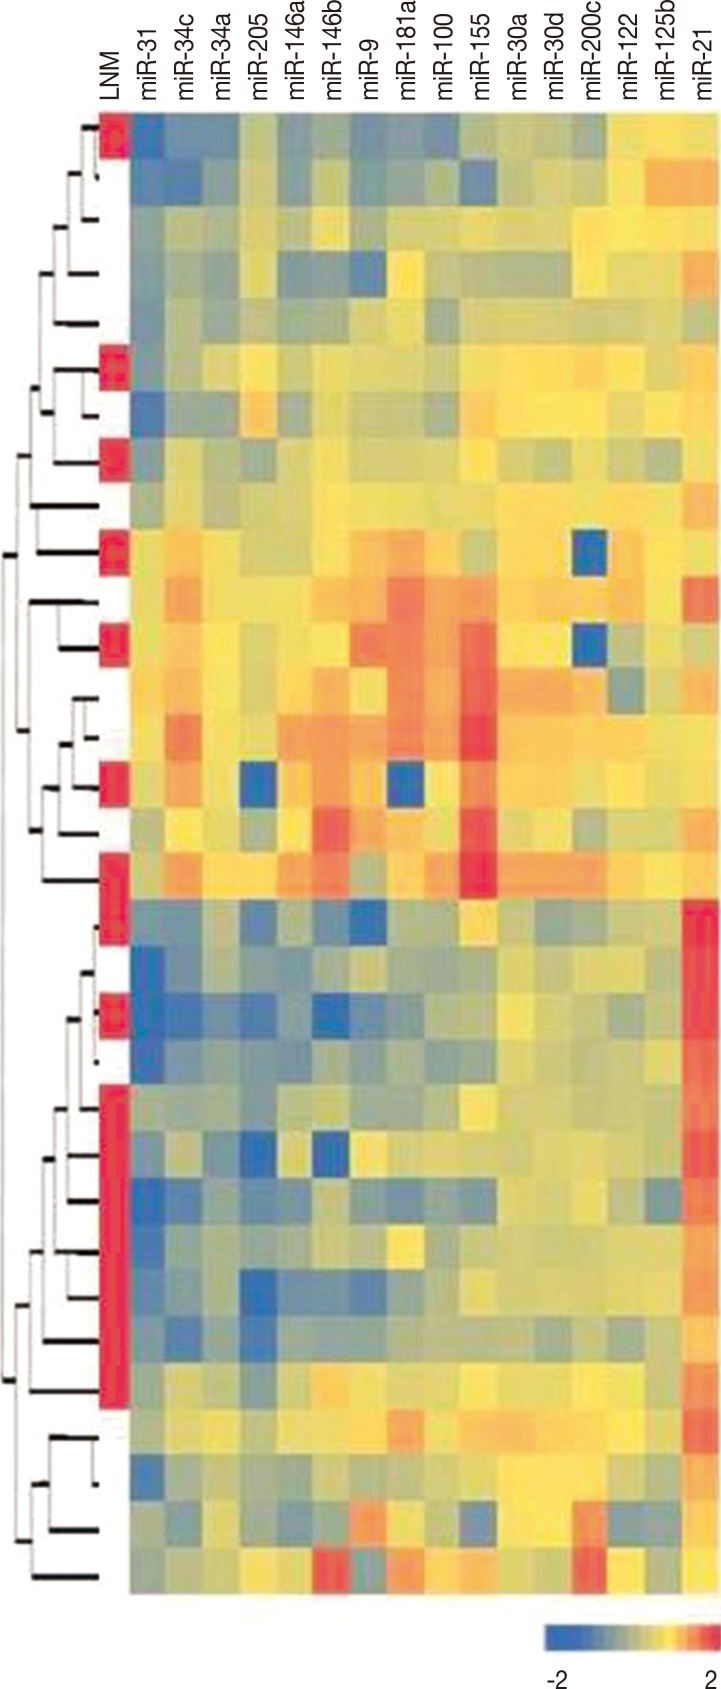
Figure 2.
Unsupervised hierarchical clustering analysis result according to all micro RNA (miRNA) levels. Heatmap colors represent normalized miRNA levels in each case, and each line represents a case. Red boxes in the first column indicates lymph node metastasis (LNM). Data are standardized by log10 transformation.

