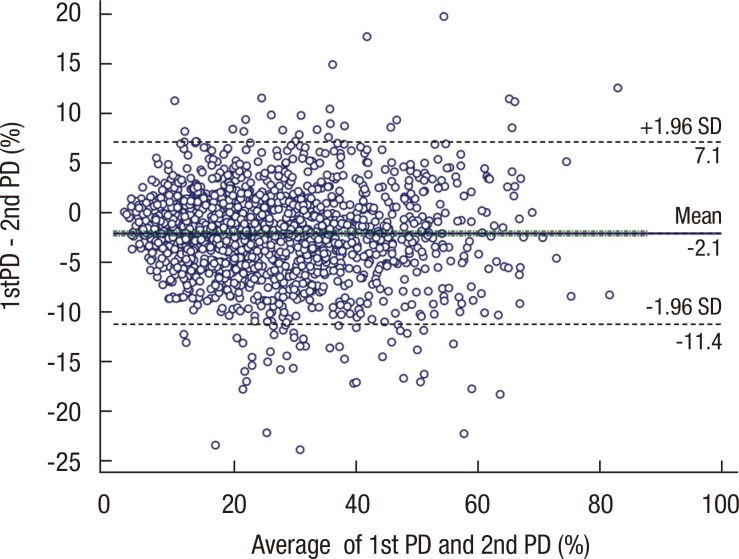
Figure 5.
Bland-Altman plot of discrepancy between the two pared percent density (PD) values. X-axis indicates the average of two PD values and Y-axis indicates the discrepancy between two PD values, and in overall this plot represents the distribution of the discrepancy between two PD values, and it doesn't show any specific pattern in its distribution.
SD=standard deviation.

