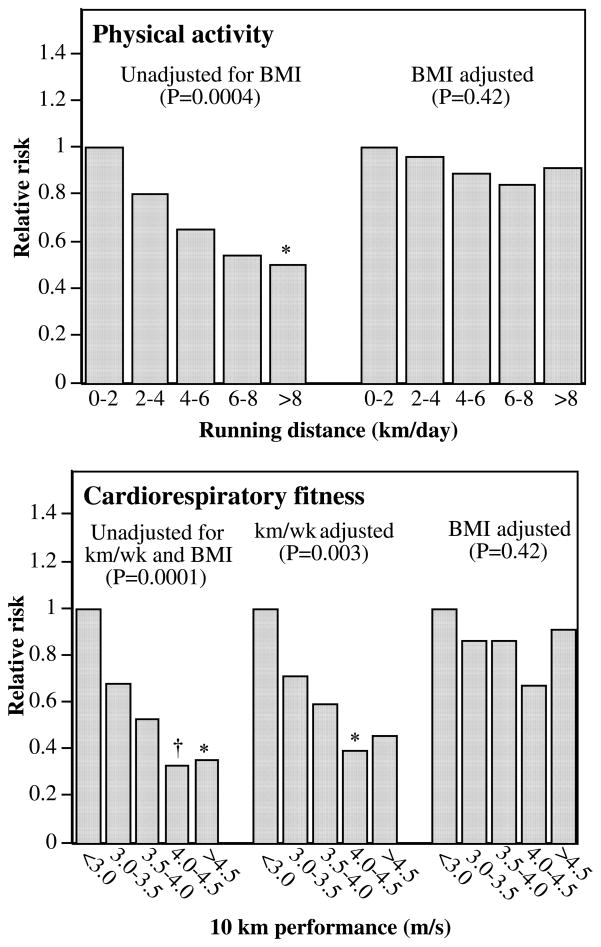
FIGURE 3.
Relative risk of incident gout by physical activity (running distance in km/d; N= 28,990) and by cardiorespiratory fitness (10-km footrace performance in m/s; N=24,400) and from Cox proportional hazard model adjusted for age, diet, aspirin use, and hypertension. Additional adjustment was made for BMI where indicated. P for trend value is reported in parentheses. Bonferroni-corrected significant differences relative to the slowest, least active men are coded as follows: * P ≤0.05, † P≤0.01, ‡ P≤0.001, and § P≤0.0001. The 95% CIs were 0.38 to 1.29 for 3–3.5 m/s, 0.30 to 1.00 for 3.5–4 m/s, 0.17 to 0.66 for 4–4.5 m/s, and 0.17 to 0.75 for >4.5 m/s for cardiorespiratory fitness and 0.54 to 1.21 for 2–4 km/d, 0.43 to 0.98 for 4–6 km/d, 0.31 to 0.92 for 6–8 km/d, and 0.31 to 0.81 for ≥8 km/d for physical activity without BMI adjustment.

