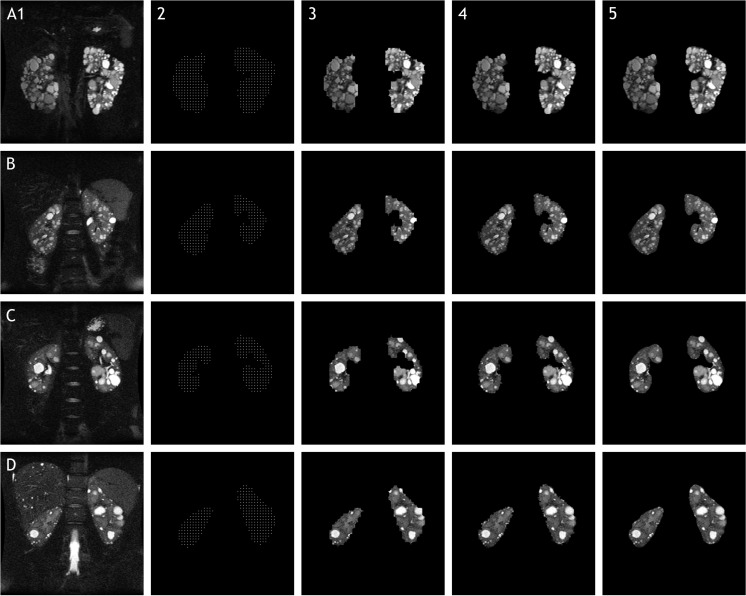
Fig. 1.
Representative slices of coronal T2-weighted SSFSE fat-suppressed MRI data from four different individuals (rows). Columns show original image (1), simulated stereology data (2), morphological preprocessing (3), raw segmentation (4), and final cleanup (5). Note that magnetic field heterogeneity in row A did not affect the result, and left kidney parenchyma was correctly segmented from adjacent spleen in rows B and D

