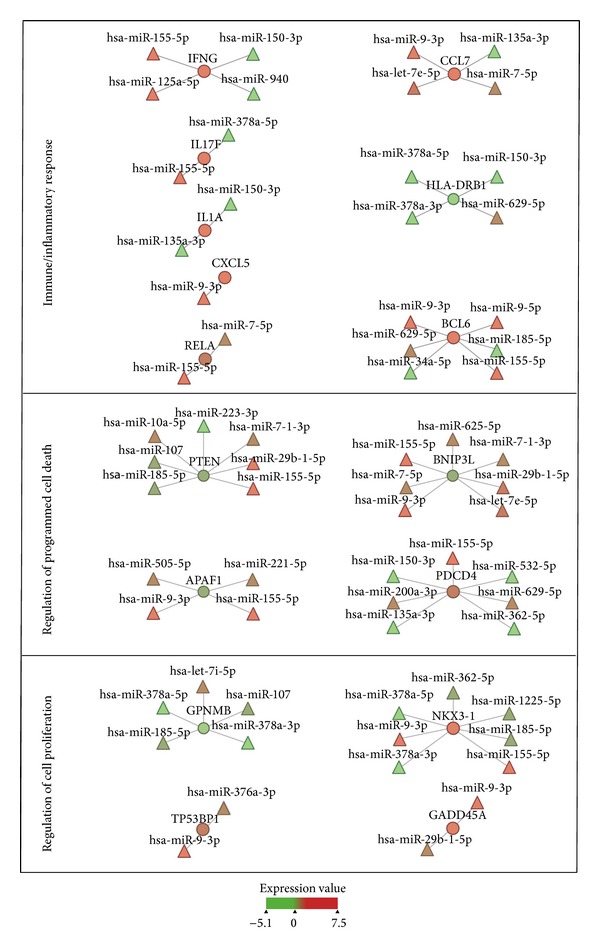
Figure 5.

Cytoscape visualization of miRNA-mRNA correlations in PBLs incubated 24 h in MMG. Relationships between miRNAs and correlated target genes involved in “immune/inflammatory response” (IFNG, CCL7, IL17F, HLA-DRB1, IL1A, CXCL5, RELA, and BCL6), “regulation of programmed cell death” (PTEN, BNIP3L, APAF1, and PDCD4), and “regulation of cell proliferation” (GPNMB, NKX3-1, TP53BP1, and GADD45A). Circles represent transcripts and triangles represent miRNAs; the expression levels of each feature are represented as color scale.
