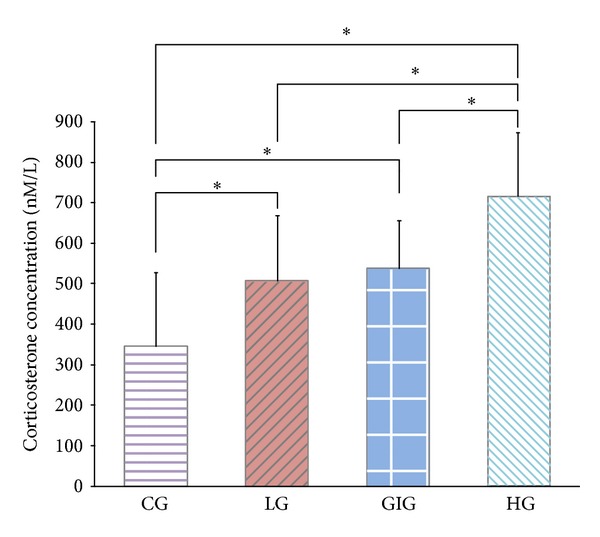
Figure 5.

Plasma corticosterone concentrations on the last day. Higher values represent higher stress. *: significant differences between groups acquired via one-way ANOVA with post hoc test. HG rats were stressed the most, and LG and GIG rats showed similar stress levels which were significantly higher than CG. Although GIG rats ran at the same velocity as HG, their average stress level was significantly lower.
