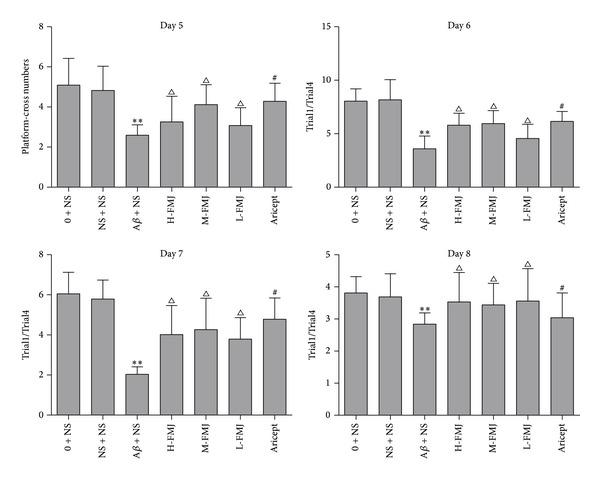
Figure 2.

The comparison of platform-cross numbers and Trail1/Trail4 in rats. **P < 0.01, compared with sham-operation group in the same time point; △ P < 0.05, compared with Aβ + NS group in the same time point; # P < 0.05, compared with Aβ + NS group in the same time point. NS: normal saline; Aβ: amyloid-β; H-FMJ: Fumanjian high dosage group; M-FMJ: Fumanjian medium dosage group; L-FMJ: Fumanjian low dosage group.
