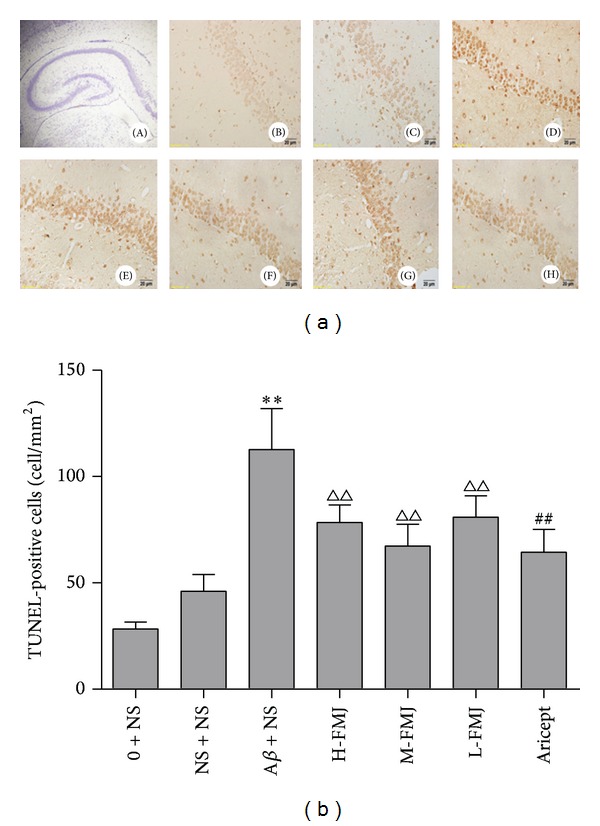
Figure 3.

Representative photomicrographs of TUNEL staining in the hippocampus CA1 area of each group (×400). (A) 100 × hippocampus; (B) normal control group; (C) sham-operated group; (D) model group; (E) Fumanjian high dosage group; (F) Fumanjian mid-dosage group; (G) Fumanjian low dosage group; (H) Aricept positive control group. Quantitative analysis showed that treatment group reduced the number of TUNEL-positive cells in the hippocampus CA1 area. **P < 0.01, compared with sham-operation group; △△ P < 0.01, compared with NS + Aβ group; ## P < 0.01, compared with NS + Aβ group. NS: normal saline; Aβ: amyloid-β; H-FMJ: Fumanjian high dosage group; M-FMJ: Fumanjian medium dosage group; L-FMJ: Fumanjian low dosage group.
