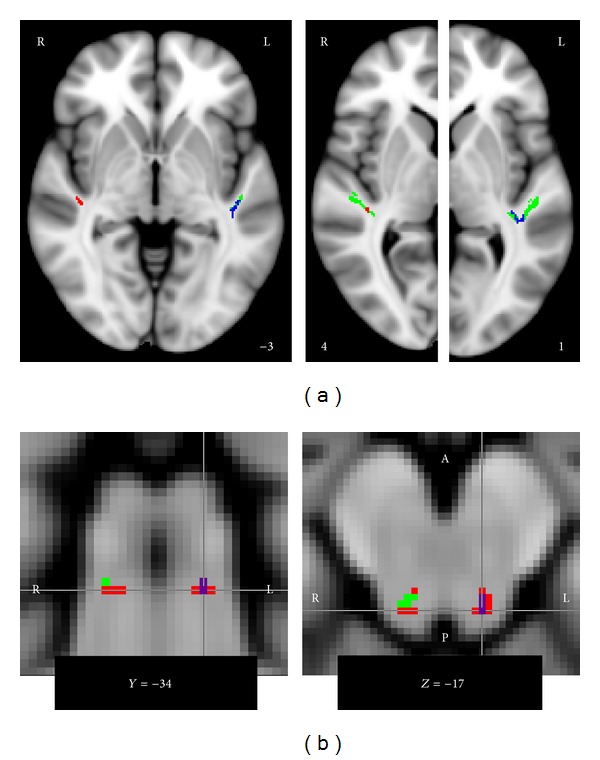
Figure 3.

Group differences regarding FA and MD in auditory ROIs. (a) Compared to controls, tinnitus patients showed significantly increased FA (red) in right ACx and significantly decreased MD (blue) in left ACx, with corresponding but nonsignificant trends in the opposite hemisphere. The ROIs are indicated in green, and the numbers at the lower edges of the images indicate the MNI z-coordinate of the illustrated horizontal slice. (b) Tinnitus patients also showed significantly increased FA (red) in the WM underneath left and right IC and significantly decreased MD (blue) in the WM underneath left IC; a corresponding trend was also present in right IC. Voxels for which both FA increases and MD increases were significant are shown in purple. The numbers at the lower edges of the images indicate the MNI coordinate of the illustrated coronal/horizontal slice.
