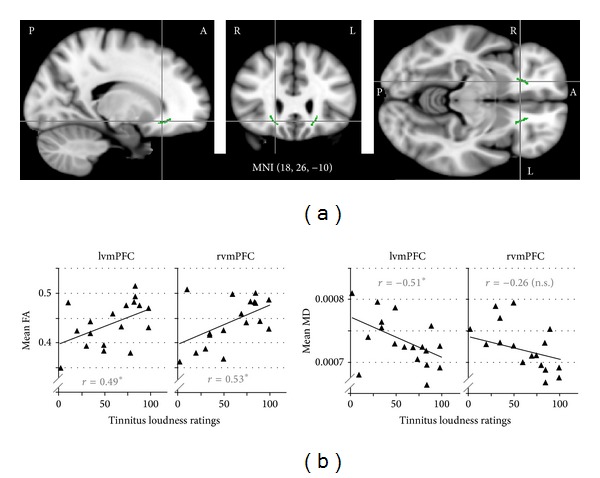
Figure 4.

Correlations between DTI measures (FA and MD) and tinnitus loudness ratings in vmPFC. (a) Sagittal, coronal, and horizontal views of the anatomically defined vmPFC ROIs (green) superimposed on the MNI 152 brain template. MNI coordinates indicate the crosshairs intersection. (b) Scatter plots illustrating correlations between DTI measures and tinnitus loudness ratings in both ROIs.
