Figure 3.

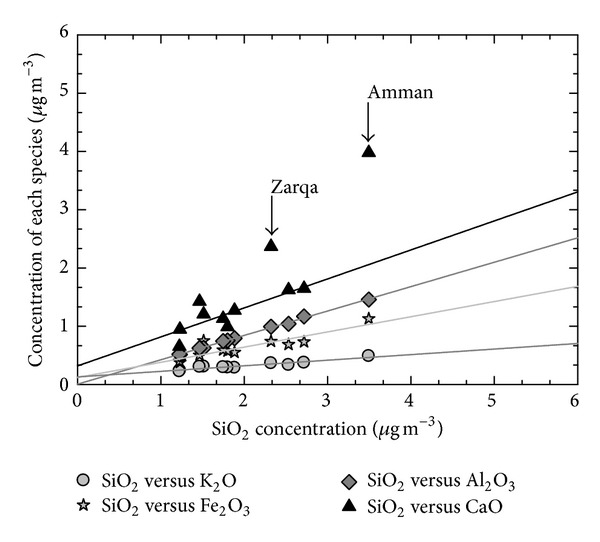
Comparison of dust oxides between sampling sites (both Amman and Zarqa data points were excluded from the CaO and SiO2 regression).

Comparison of dust oxides between sampling sites (both Amman and Zarqa data points were excluded from the CaO and SiO2 regression).