
Figure 2.
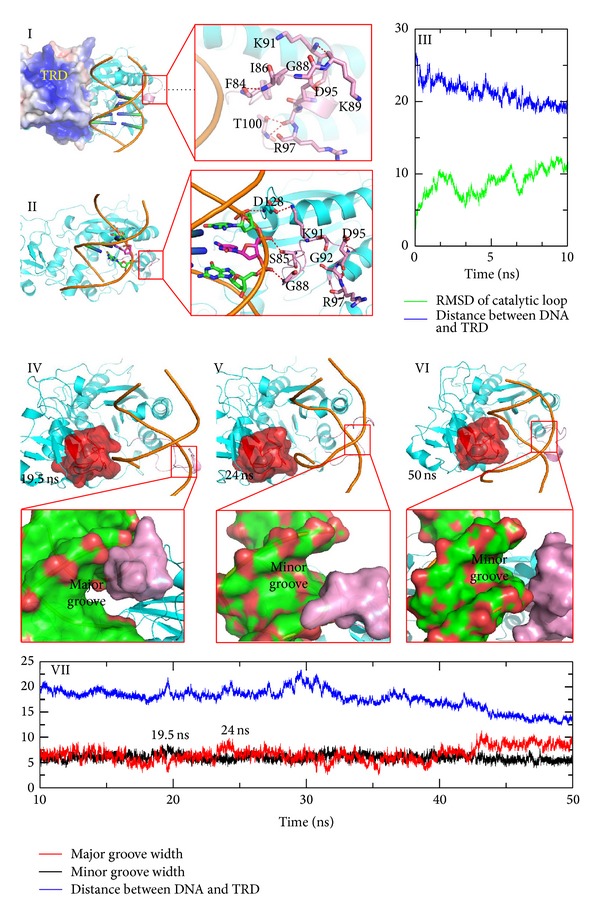
DNA migrates into a cleft between TRD and catalytic loop. Nonspecific DNA binding initiating the conformational transition of the catalytic loop is shown in the top. (I) Structure of the initial model. The open state of the catalytic loop is stabilized by hydrogen bonds between the main chain atoms. The electrostatic surface is generated by APBS and the positively charged area is colored blue. (II) Snapshots extracted from the MD simulation. Residues at the tip of the catalytic loop move toward the DNA backbone because hydrogen bonds between the side chain atoms and the DNA backbone replace the original hydrogen bond network. (III) RMSD and distance plot along trajectory. The distance COM of the target recognition loop (residues 230–260) and COM of GCGC are plotted in blue lines, whereas the RMSD values of the catalytic loop are plotted in light green lines. A series of snapshots that describe DNA rotation in a cleft between the TRD and the catalytic loop is shown at the bottom. (IV)–(VI) Different snapshots extracted from the trajectory. TRDs are represented with a red extended surface; major and minor grooves are also highlighted using the extended surface. (VII) Groove width and distance plot determined from the MD simulation. The major width plot is colored red, the minor groove is colored black, and the distance is colored blue.