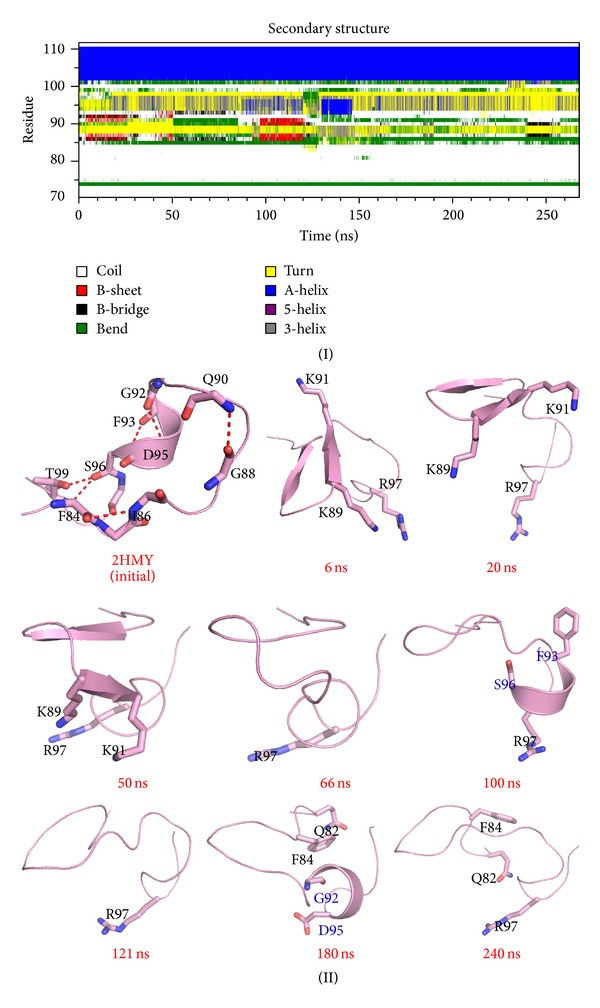
Figure 5.

Conformational transition of catalytic loop during simulation. (I) Secondary structure profile of the catalytic loop. (II) Snapshots extracted from the MD simulation. In the 100 and 180 ns snapshots, the beginning and end of the short helix are colored blue. Carbon atoms are colored pink, and other atoms are colored using default settings in PyMol.
