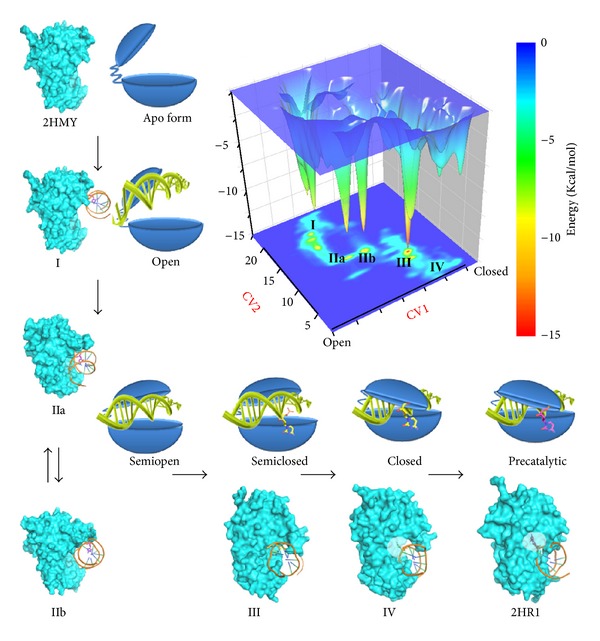
Figure 6.

Inactive to active form transition. Free energy profile acquired from metadynamics simulation is shown in upper right corner. To describe the open to closed conformational transition of catalytic loop, path CV (CV1) [29] is used. In addition, we used a distance CV (CV2) that measures the distance between the COM of the GCGC base pair and the COM of the two target recognition loops. No bias is added to the distance CV, and the statistics collected during the metadynamics simulations are used to generate the final FES using the reweighting protocol [60] according to Limongelli's approach [61]. Proposed transition path from inactive form (2HMY) to active form (2HR1) is represented in an “L” shaped manner. (I)–(IV) show different basins obtained from the metadynamics simulation. Basins IIa and IIb are noted because their protein conformations are similar. Proteins are represented by an extended surface. In snapshots (IV) and (2HR1), residues around the flipped base are semitransparent to aid visualization of the flipped base. Schematic diagrams of these different states are placed beside the corresponding snapshots. Proteins are represented in a Pac-Man-like form [62] with the upper cap and lower base connected by a hinge. DNA is represented using the double helix.
