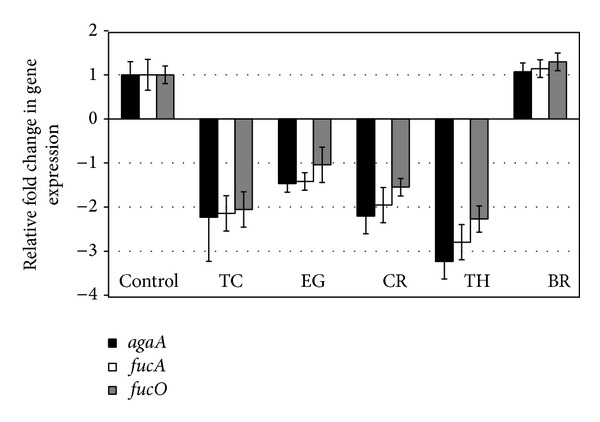
Figure 6.

Effect of PDAs on EHEC mucus utilization genes in RF. Treatments include control (0 mM), TC (0.75 mM), EG (1.85 mM), CR (0.65 mM), TH (0.65 mM), and BR (2.6 mM). Error bars represent SEM (n = 3). *All the treatments except BR are significantly different from control at P < 0.05.
