Figure 1.

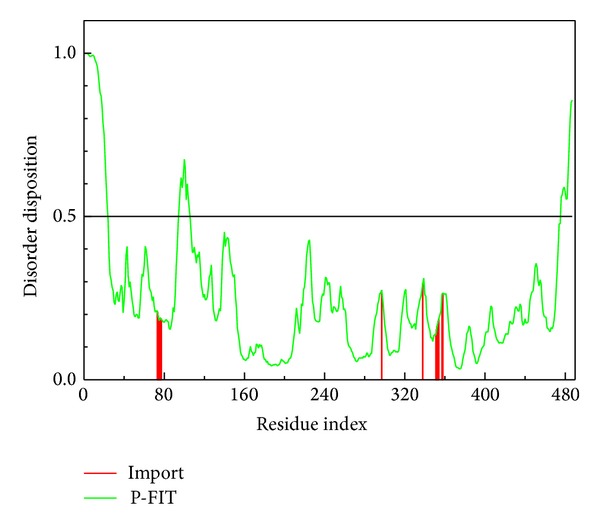
The disorder region prediction and binding site detection. The green curve is the disorder disposition of each amino acid, and the red lines are the residues of the important amino acids.

The disorder region prediction and binding site detection. The green curve is the disorder disposition of each amino acid, and the red lines are the residues of the important amino acids.