
Figure 9.
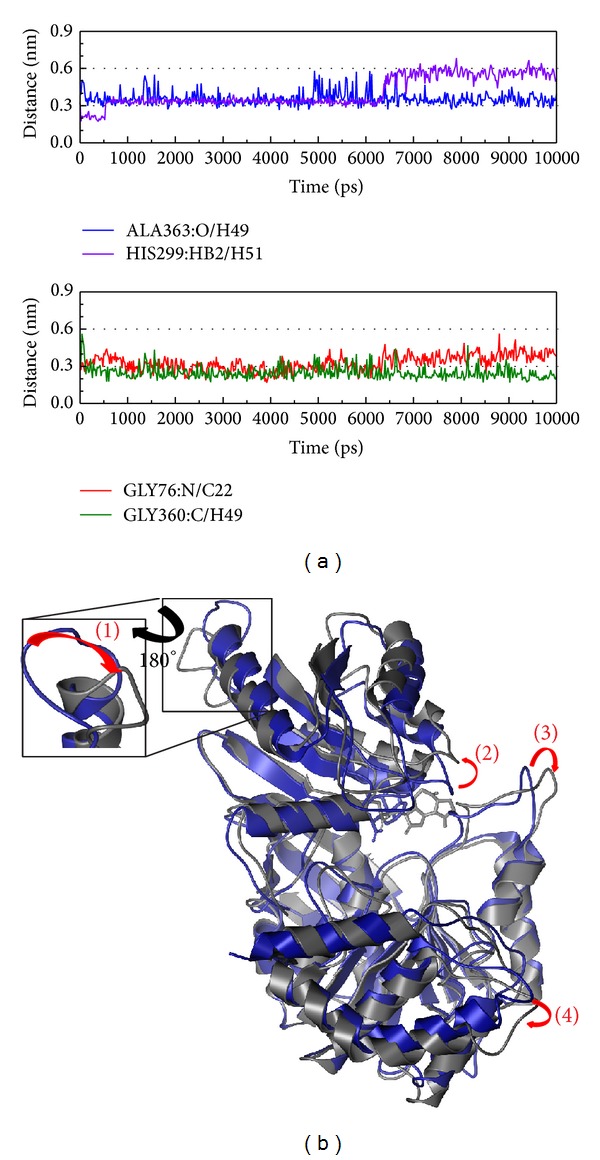
The variation of Saussureamine C and Folylpolyglutamate synthetase complex in MD simulation. (a) H-bond variation and (b) structural variation. The (1)–(4) red color indicates the difference through MD simulation.
Official websites use .gov
A
.gov website belongs to an official
government organization in the United States.
Secure .gov websites use HTTPS
A lock (
) or https:// means you've safely
connected to the .gov website. Share sensitive
information only on official, secure websites.
The variation of Saussureamine C and Folylpolyglutamate synthetase complex in MD simulation. (a) H-bond variation and (b) structural variation. The (1)–(4) red color indicates the difference through MD simulation.