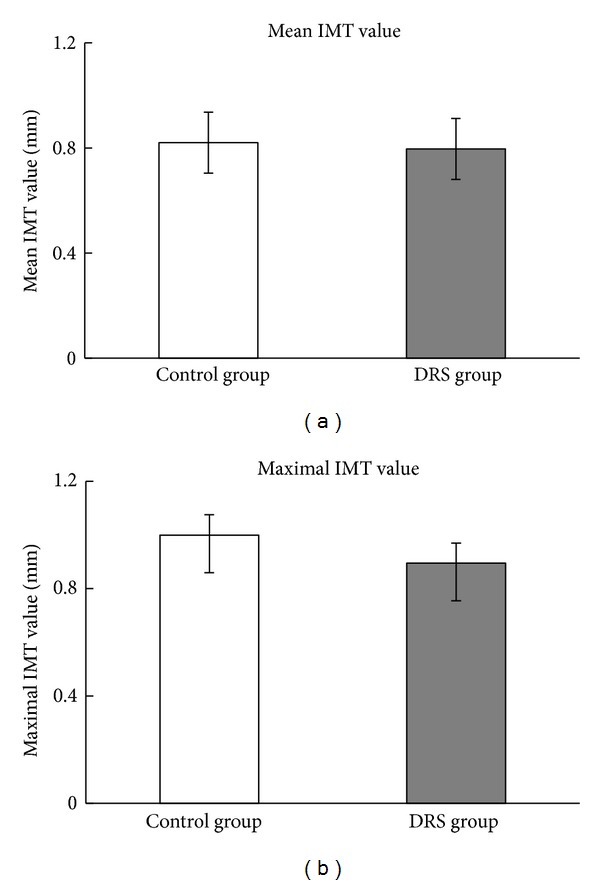
Figure 3.

IMT measurements in DRS and control group. (a) Mean common carotid artery intima-media thickness. Results are presented as mean (SD); (b) maximal common carotid artery intima-media thickness. Results presented as median (Q1; Q2). (a) and (b): n control group = 24, n DRS group = 20.
