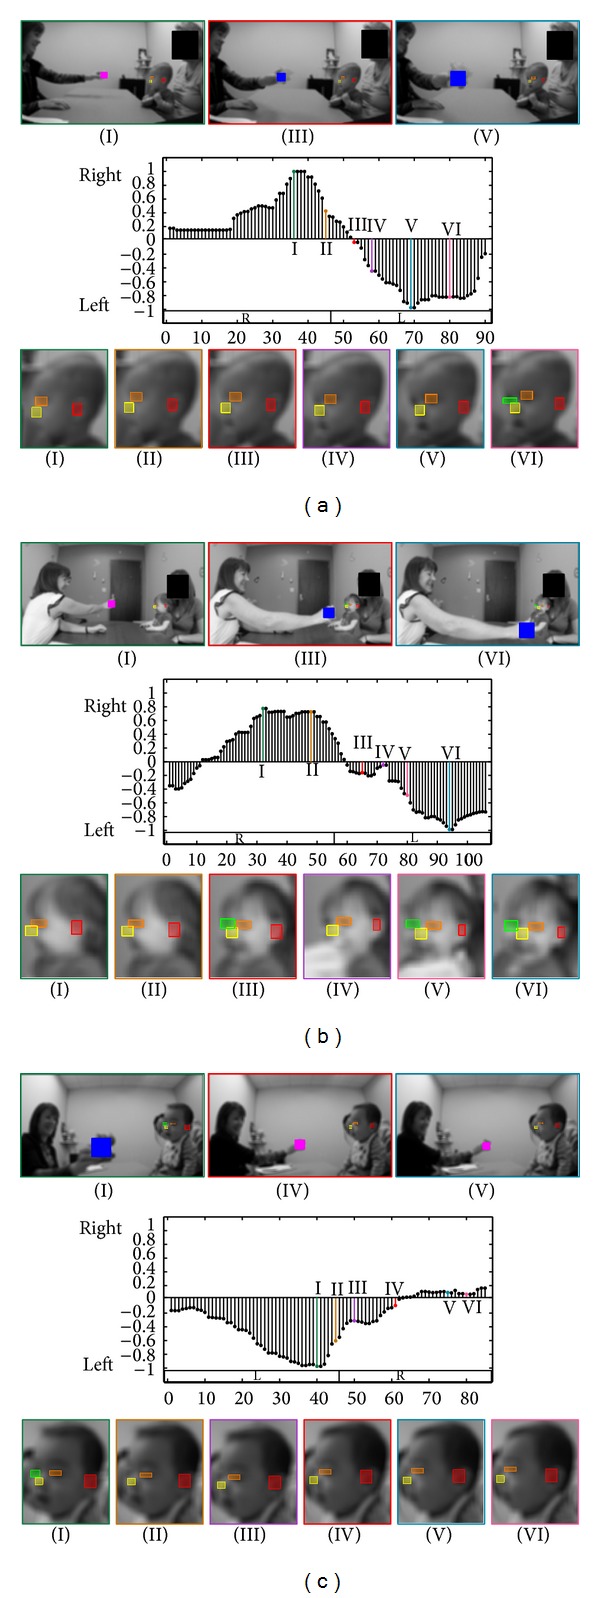
Figure 3.

(a) First example of the Visual Tracking task. Top: when the clinician is holding the object, when the object is at one extreme side (right or left), and when the object is at the other extreme side. Middle: changes in the yaw motion ( values in the y-axis; see Appendices A and B) for every frame (x-axis). The boxes labeled “R” and “L” represent when the object is to the right and left of the participant, respectively. The gray shaded areas represent when the object is not moving and at an extreme side (either right or left). Bottom: 6 examples of the infant's face during the task. Colors and roman numerals identify corresponding images and spikes in the graph. (b, c) Two examples of the Visual Tracking task.
