Figure 2.

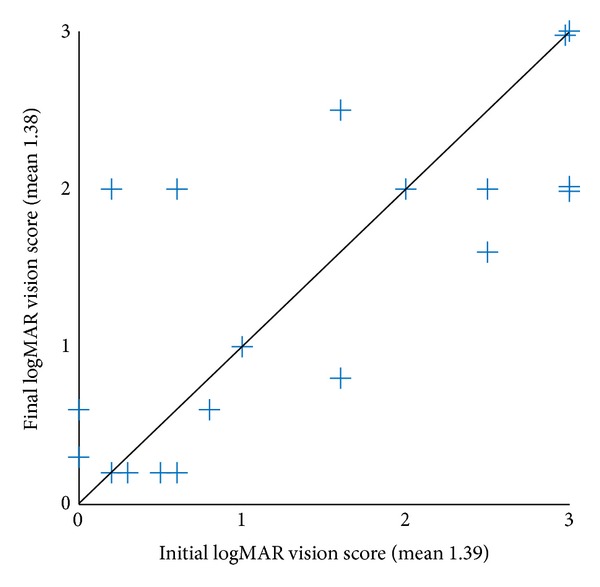
Distribution of final logMAR vision score in correspondence with the initial one in the control group (n = 19). P value = 0.73. LogMAR: logarithm of the minimal angle of resolution. Analysis was done using Wilcoxon signed-rank test.

Distribution of final logMAR vision score in correspondence with the initial one in the control group (n = 19). P value = 0.73. LogMAR: logarithm of the minimal angle of resolution. Analysis was done using Wilcoxon signed-rank test.