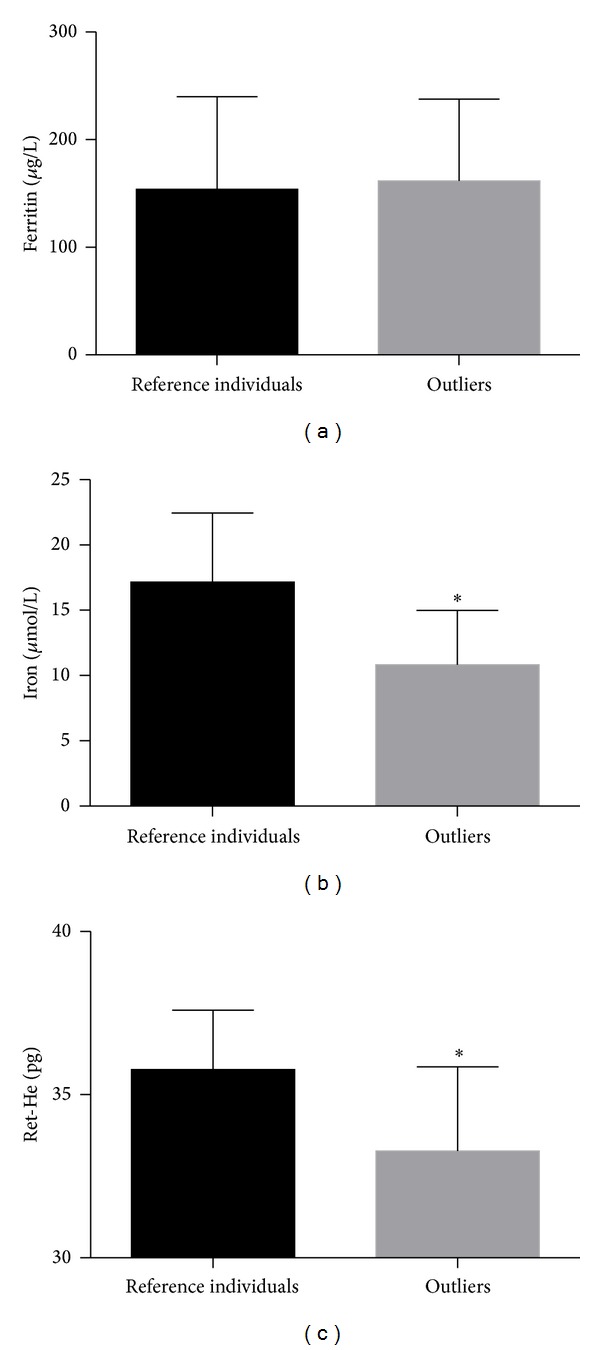
Figure 1.

Ferritin (a), iron (b), and Ret-He (c) values in reference individuals (normal h-CRP) (n = 119) compared with outliers (higher h-CRP) (n = 14). The normal CRP reference range (<10.2 mg/L) was based on a reference population study. The graph shows the means ± standard deviation. *P < 0.001.
