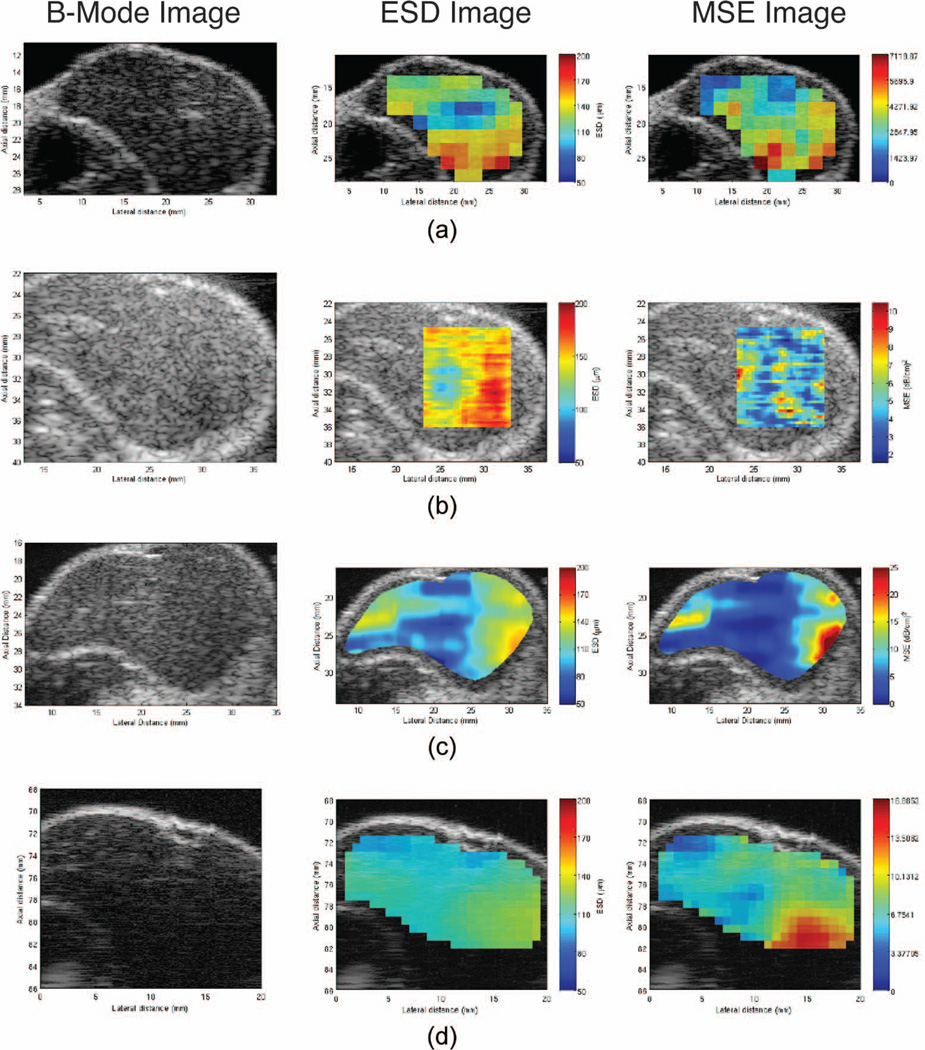
Fig. 6.
B-mode images and parametric images enhanced by effective scatterer diameter (ESD) and mean square error (MSE) of R4 are shown as an example. First the B-mode image, followed by the ESD image and the MSE of the Gaussian form factor fit for each imaging system: (a) Ultrasonix, (b) Zonare, (c) Siemens, and (d) laboratory system. The color map for the ESD values all range from 50 to 200 µm.

