
Figure 3. Transformations of NO3−-N (A, solid line), NO2−-N (A, dashed line) (A) and N2O in the gas (B, solid line) and liquid phases (B, dashed line) in the absence (control) and presence of non-modified SWNT and carboxyl-modified SWNT.
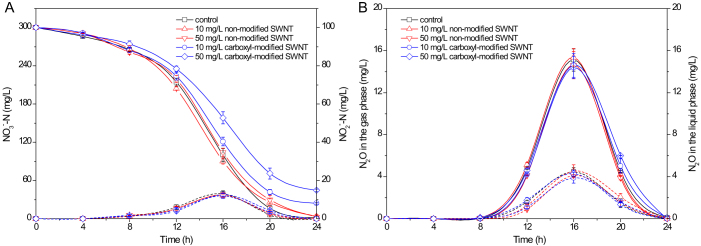
Error bars represent standard deviations of triplicate measurements.