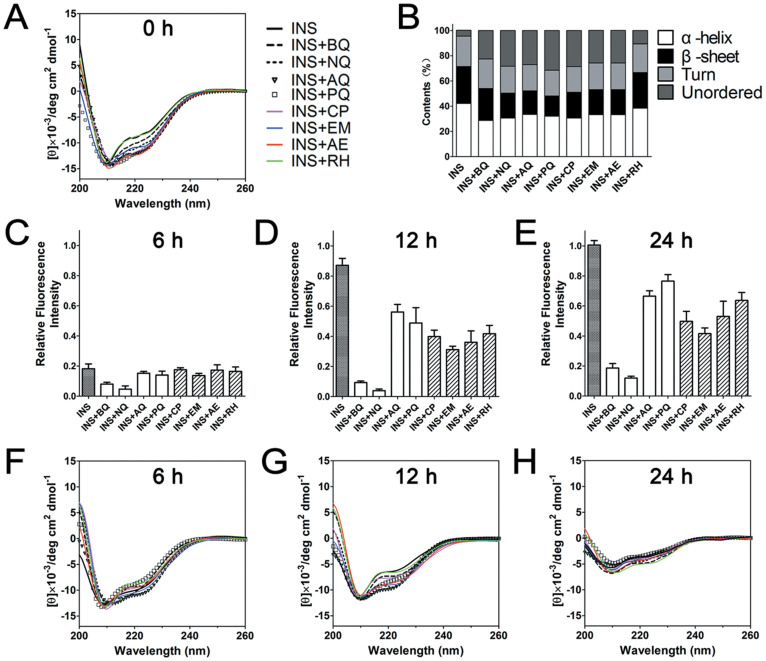
Figure 4. Secondary structures of insulin in the presence and absence of quinones.
Far-UV circular dichroism spectra of sample groups at 0 h (A), and percentages of secondary structure contents (B). Relative thioflavin-T fluorescence intensities at 6 h (C), 12 h (D). 24 h (E) and corresponding far-UV circular dichroism spectra (F–H). The fluorescence signals of all samples were normalized against that of insulin incubated for 24 h, which was set as 1.

