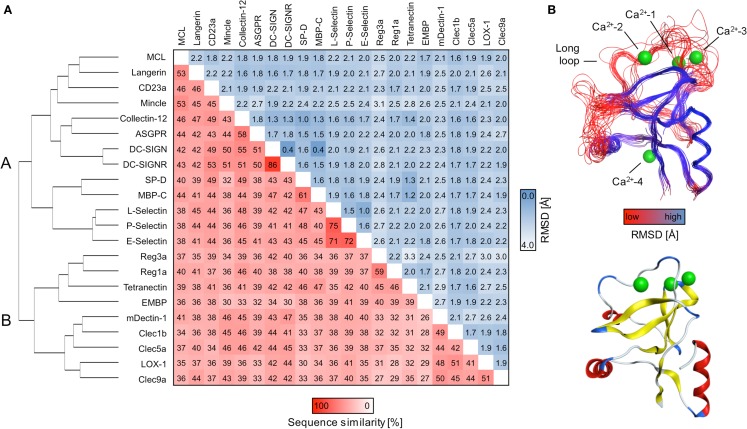
Figure 1.
Sequence alignment and consensus structure of CTLRs. (A) The dendrogram depicts the hierarchical clustering of CRDs based on a structure-based multiple sequence alignment. The two major branches are termed cluster A and B. Pairwise sequence similarities and RMSDs of Cα atoms are shown in matrix format. (B) Key structural features of the CTLD fold are mapped on the predicted consensus structures (top). The peptide backbone is displayed as a continuous line and colored according to RMSD of Cα atoms. The CRD of DC-SIGN (PDB code: 2XR6) is shown for comparison (bottom). The ribbon representation is colored according to secondary structure elements (red: α-helices; yellow: β-strands; blue: loop regions).

