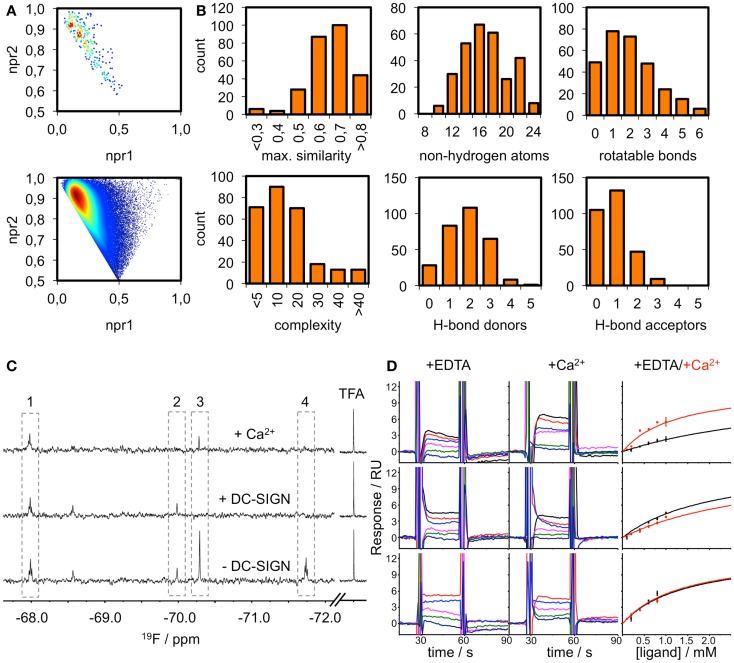
Figure 3.
Fragment library and screening against DC-SIGN. (A) Molecular shape distribution of the 281 fluorinated fragments was assessed using normalized moments of inertia plots of the fragment library (top) and molecules from the ZINC database fragment set (bottom). (B) The diversity of the library is displayed for a selection of molecular descriptors. Histograms of the maximum pairwise similarity, number of non-hydrogen atoms, number of rotatable bonds, molecular complexity, and number of hydrogen bond donors/acceptors are shown. (C) Examples from the 19F NMR screen using T2-filtered spectra (T = 1.0 s, νCPMG = 50 Hz) showing compounds that do not bind (1), bind Ca2+-dependently (2), are competed by Ca2+ (3) and are binding at another binding site (4). (D) Sensorgrams for three examples from the SPR follow-up are shown. DC-SIGN ECD was immobilized on a CM7 chip. A one-site-binding model was used for fitting the data. This exemplifies compounds that experience increased (top), decreased (middle), or no alteration of affinity (bottom) in the presence of Ca2+. Data were extracted from regions of the sensorgram not perturbed by injection peaks. SPR sensorgrams are representatives of three independent measurements.

