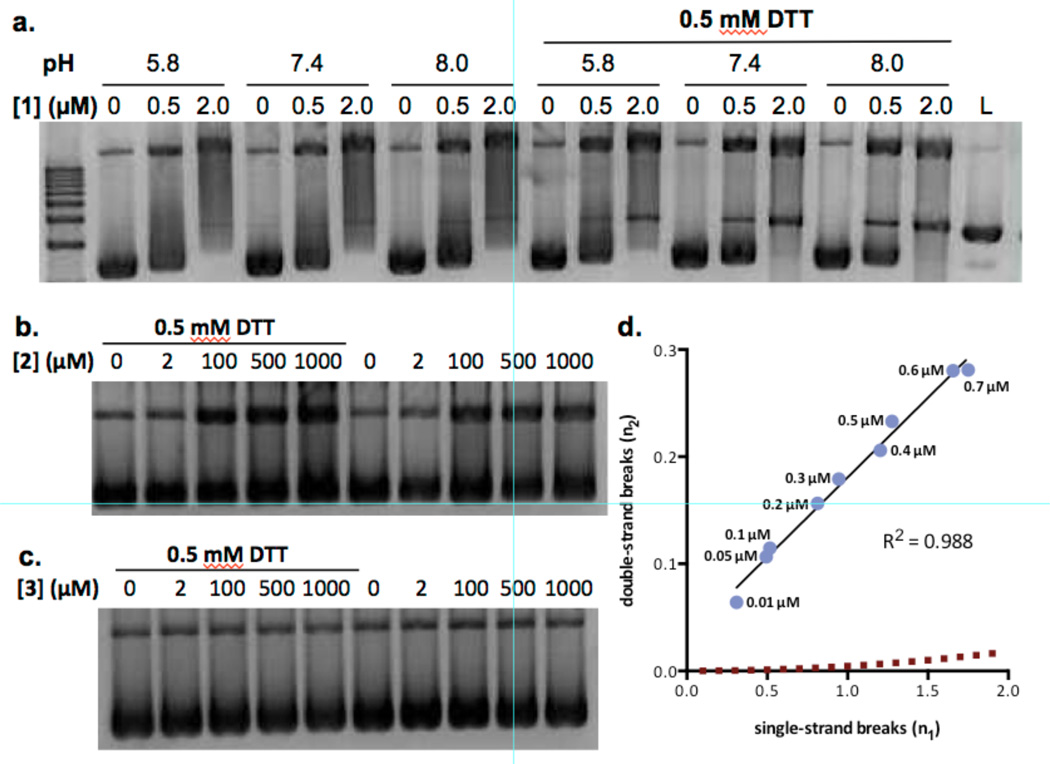
Figure 2.
Analysis of nicked and cleaved plasmid pBR322 DNA by (–)-lomaiviticin A (1), (–)-lomaiviticin C (2), and (–)-kinamycin C (3). a. Plasmid damage induced by 1, [1] = 0.5 or 2.0 µM, pH = 5.8, 7.4, or 8.0, [DTT] = 0 or 0.5 mM, 37 °C, 16 h. b. Plasmid damage induced by 2, [2] = 2–1000 µM, pH 7.4, [DTT] = 0 or 0.5 mM, 37 °C, 16 h. c. Plasmid damage induced by 3, [3] = 2–1000 µM, pH 7.4, [DTT] = 0 or 0.5 mM, 37 °C, 16 h. Top band: Form II (nicked) DNA, middle band: Form III (linearized) DNA, bottom band: Form I (supercoiled) DNA. d. Ratio of DNA dsbs () to ssbs () per DNA molecule in a plasmid cleavage assay using 1. Data points (left to right) correspond to 0.01, 0.05, 0.1, 0.2, 0.3, 0.4, 0.5, 0.6, 0.7 µM of 1. The dashed line represents the Freifelder–Trumbo relationship, defined as where h = 23.8 and L = 4361. Quantitative analyses and statistical treatments are presented in the Supporting Information.

