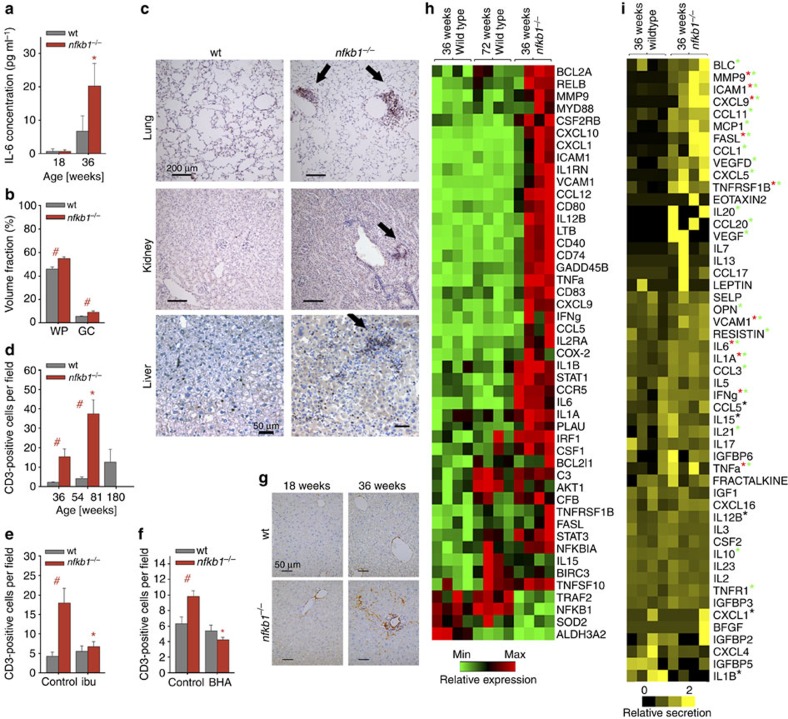
Figure 1. Loss of nfkb1 induces an inflammatory phenotype in mice.
All data are mean (M) ±s.e.m., 5–6 animals per group, if not otherwise indicated. Significant differences (ANOVA, P<0.05) to young animals are indicated by *, and between wt and nfkb1−/− strains at the same age group by #. (a) IL-6 levels in blood plasma as measured by ELISA at the indicated ages. (b) White pulp (WP) and germinal center (GC) volume densities measured on spleen H&E images at 36 weeks of age. (c) Representative CD3 immunohistochemistry at 36 weeks of age showing increased immune cell infiltrations (arrows) in lung (top), kidney (middle) and liver (bottom) of nfkb1−/−, but not wt, mice. (d) Frequencies of CD3-positive cells in livers at the indicated ages. (e) Frequencies of CD3-positive cells in livers at 32 weeks of age following treatment of mice with ibuprofen or vehicle for 8 weeks. (f) Frequencies of CD3-positive cells in livers at 12 weeks of age following treatment of mice with the antioxidant BHA or vehicle for 4 weeks. (g) Representative α smooth muscle cell actin (α-SMA) immunohistochemistry showing increased pro-fibrotic activity in livers from nfkb1−/− mice. (h) Expression of NF-κB target genes in liver (qPCR array) at the indicated ages, n=4 per group. All genes that are significantly changed (P<0.05) in at least one group are shown. (i) Cytokine expression pattern in liver at 36 weeks of age, n=4 per group. Green star indicates proteins upregulated in nfkb1−/− (P<0.10, t-test), red star indicates that mRNA upregulation (h) was confirmed at protein level, black star indicates that mRNA upregulation was not confirmed at protein level.

