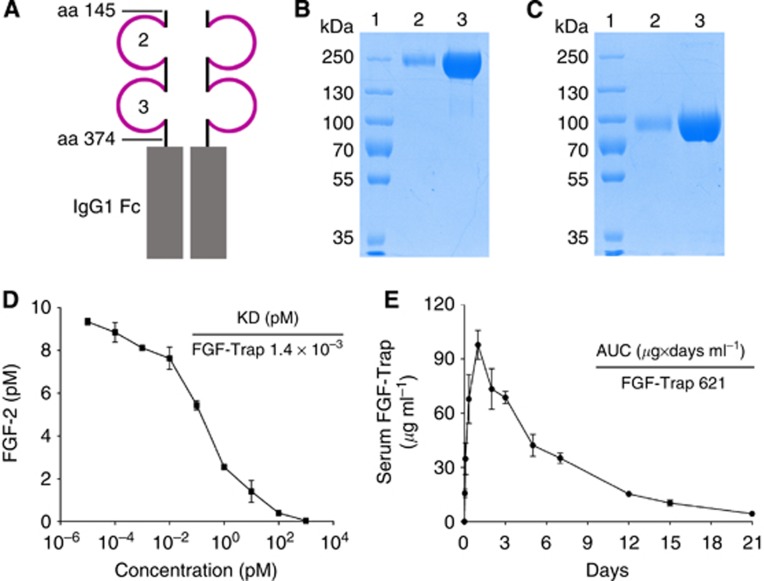
Figure 2.
The structure and characterisation of FGF-Trap.(A) Schematic representation of the structure of FGF-Trap. (B and C) Sodium dodecyl sulphate–polyacrylamide gel electrophoresis (SDS–PAGE) analyses of FGF-Trap under non-reducing (B) and reducing (C) conditions. Lane 1, protein marker; lane 2, 1 μg FGF-Trap; lane 3, 10 μg FGF-Trap. (D) Binding affinity of FGF-Trap for FGF-2 was determined by incubation of FGF-Trap with 10 pM FGF-2. (E) Pharmacokinetic analysis of FGF-Trap. FGF-Trap of 100 μg was intraperitoneally injected into BALB/c nude mice, and blood was drawn at the indicated time points. The serum level of FGF-Trap was measured by enzyme-linked immunosorbent assay. The colour reproduction of this figure is available on the British Journal of Cancer journal online.

