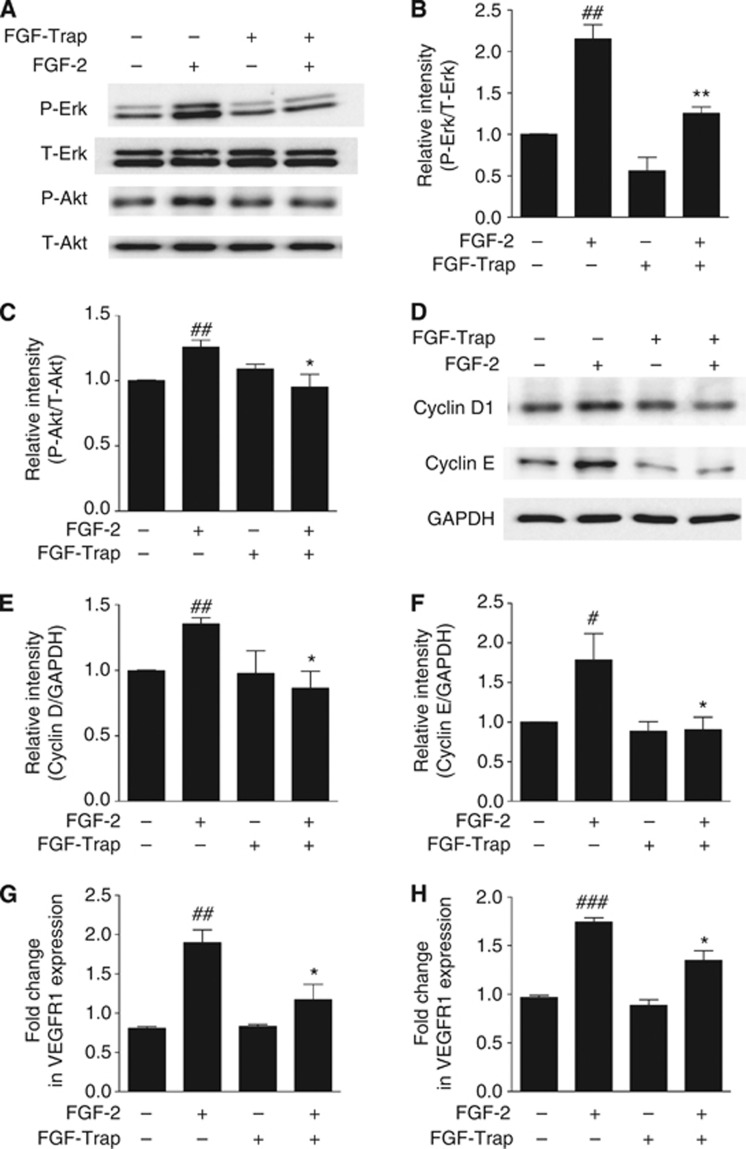
Figure 4.
Fibroblast growth factor-Trap suppresses FGF-2-mediated signalling pathways, cell cycle progression and VEGFR mRNA expression. (A) Representative western blots of phosphorylated (P-Erk) and total Erk1/2 (T-Erk), phosphorylated (P-Akt) and total Akt (T-Akt) from HUVECs induced with or without FGF-2 (10 ng ml−1) and FGF-Trap (5 μg ml−1) for 10 min. (B and C) Quantitative results are illustrated for (A). Each column represents the density of the immunoreactive P-Erk band (B) normalised to the T-Erk band, and P-Akt band (C) normalised to the T-Akt band from a minimum of three independent assays. ##P<0.01, compared with untreated cell; *P<0.05, **P<0.01, compared with FGF-2-treated cell using unpaired, two-tailed t-tests. (D) Representative western blots of cyclins D1 and E in HUVECs treated with or without FGF-2 (20 ng ml−1) and FGF-Trap (10 μg ml−1) for 3 days. Glyceraldehyde 3-phosphate dehydrogenase (GAPDH) was used as a protein loading control. (E and F) Quantitative results are illustrated for (D). Each column represents the density of the immunoreactive cyclin D1 band (E) and cyclin E band (F) normalised to the GAPDH band from a minimum of three independent assays, respectively. ##P<0.01, compared with untreated cell; *P<0.05, compared with FGF-2 treated cell using unpaired, two-tailed t tests. (G and H) Expression of VEGFR1 (G) and VEGFR2 (H) mRNA was quantified using qPCR. Changes in mRNA expression were expresses as fold change relative to β-actin (n=3). ##P<0.01, ###P<0.001, compared with untreated cell; *P<0.05, compared with FGF-2 treated cell using unpaired, two-tailed t-tests.

